Audit log streams is a paid feature.If you’re using Infisical Cloud, then it is available under the Enterprise Tier. If you’re self-hosting Infisical, then you should contact sales@infisical.com to purchase an enterprise license to use it.
Disabling PostgreSQL Audit Log Storage
If you’re using audit log streams as your primary log destination and don’t need audit logs stored in PostgreSQL, you can disable PostgreSQL audit log storage by setting the following environment variable:See the environment variables reference for all available audit log configuration options.
Overview
Create Stream
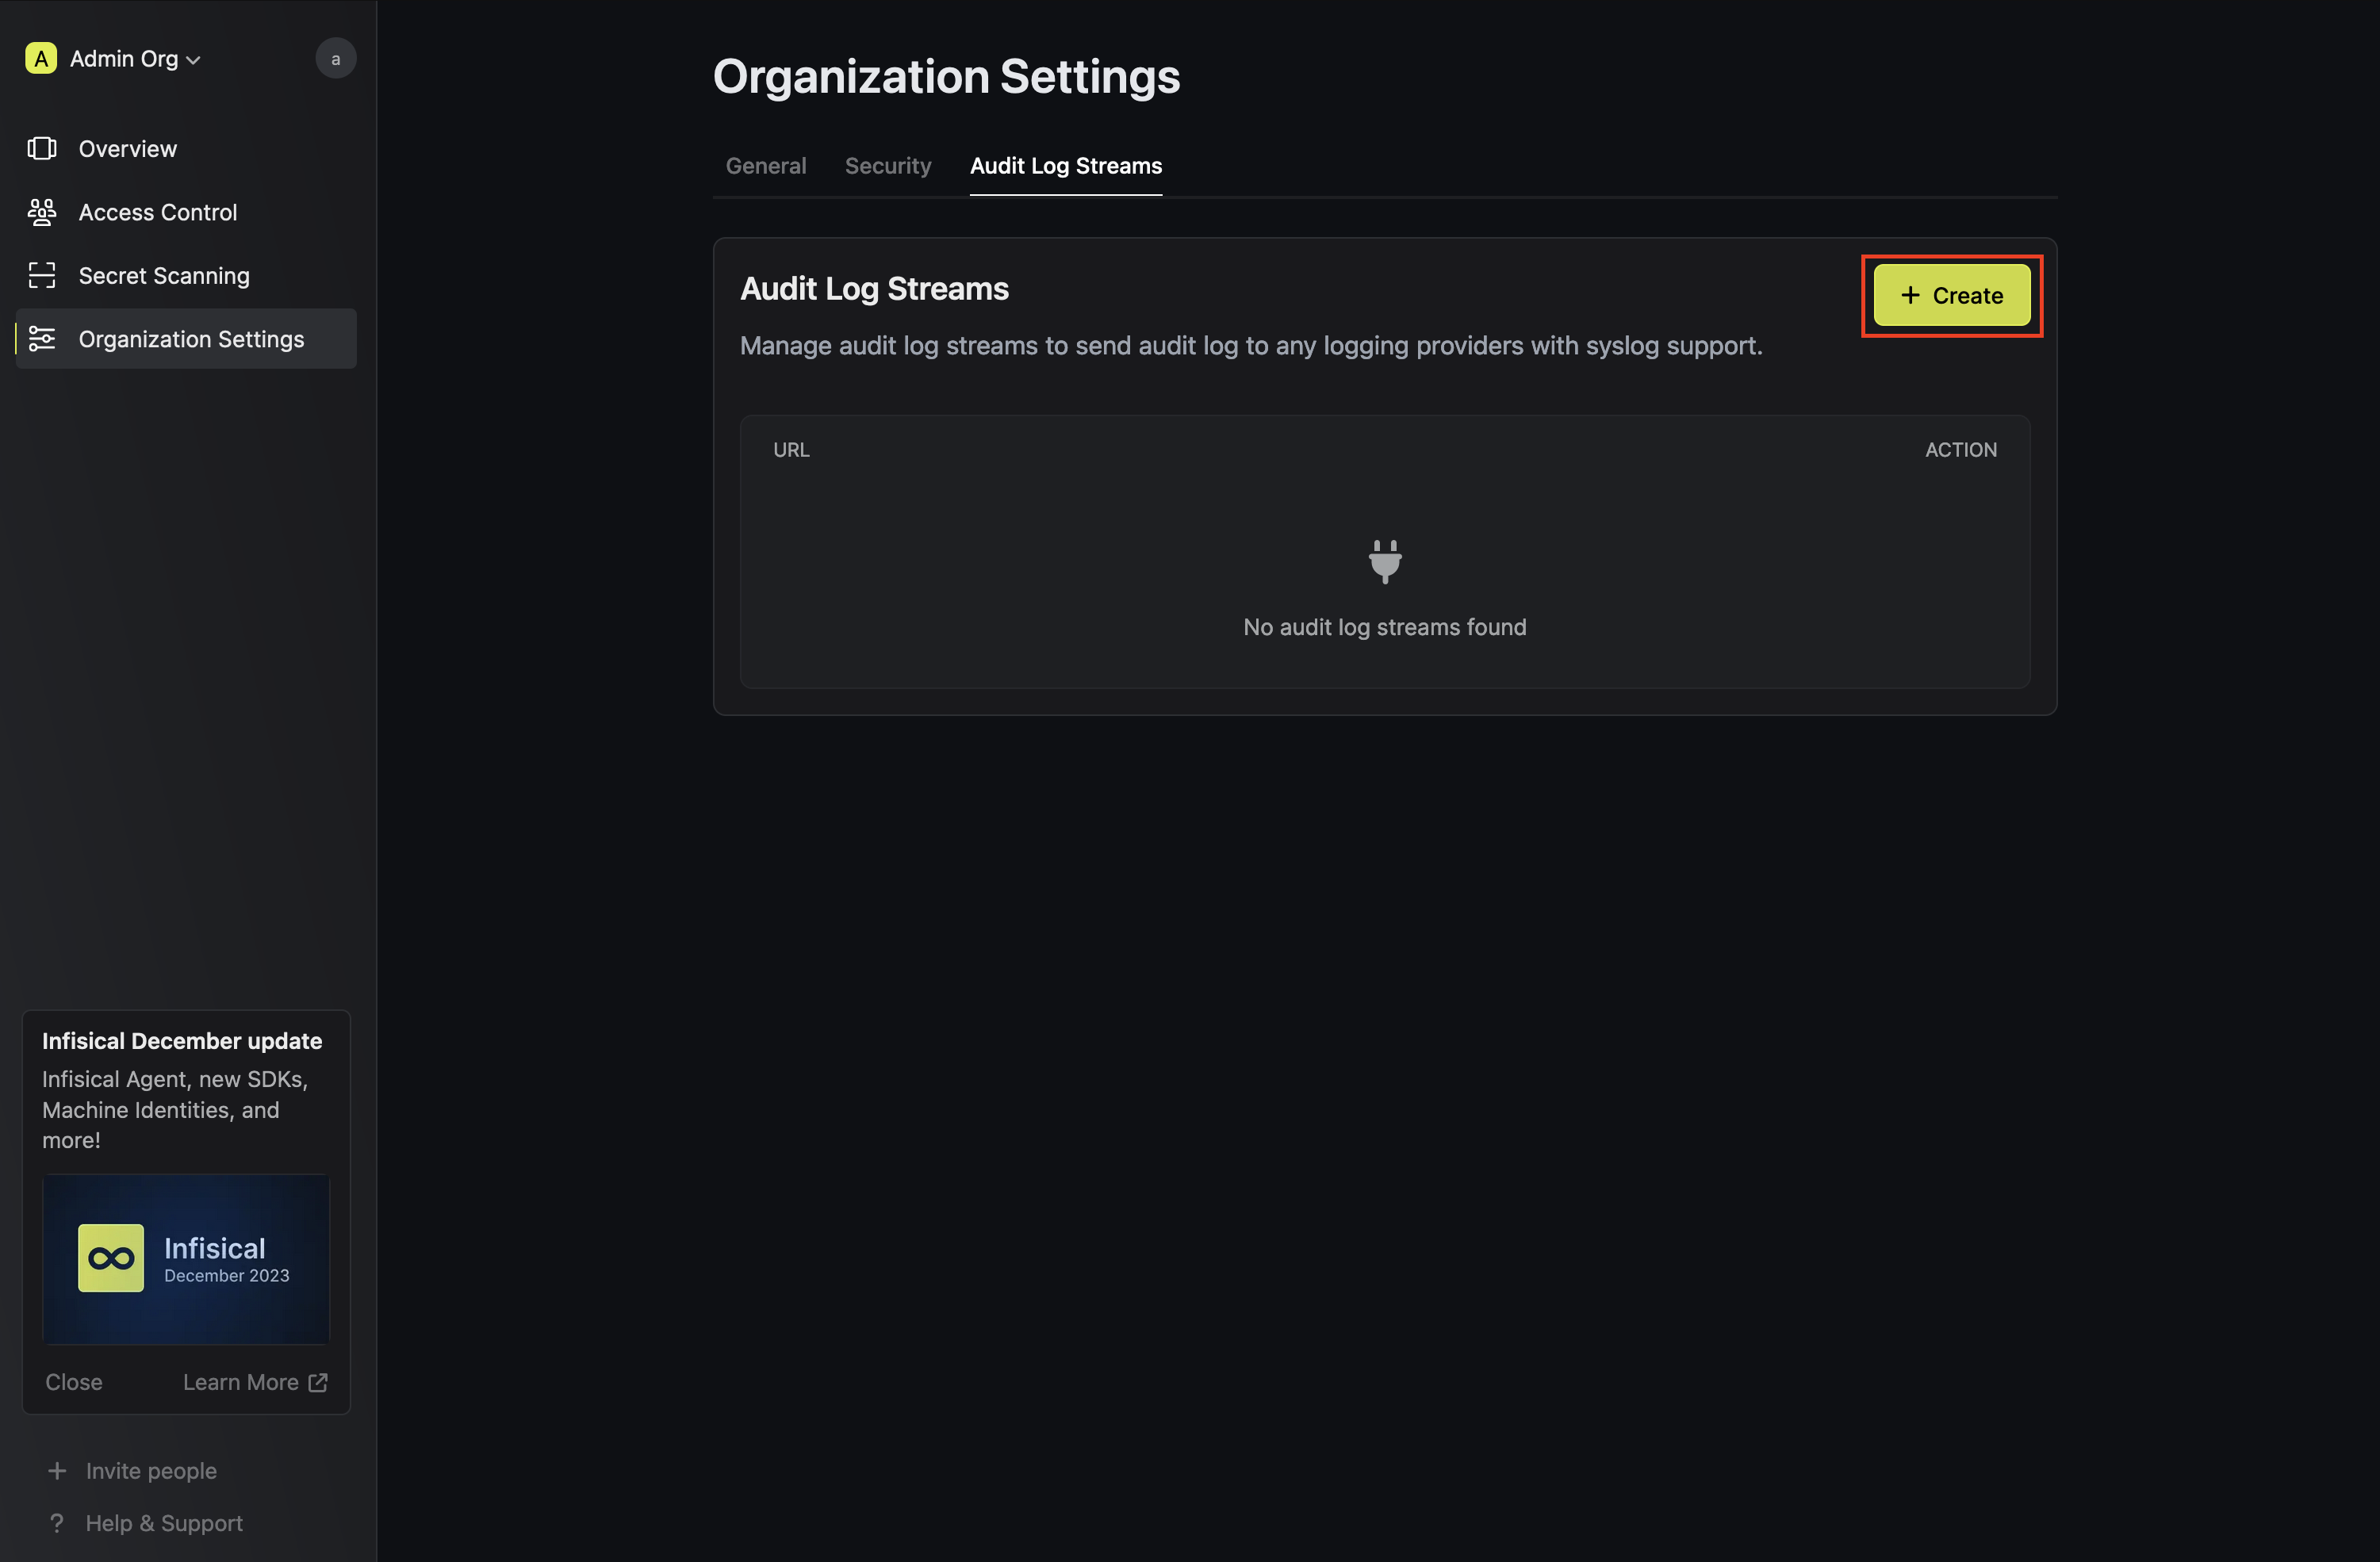
- Navigate to Organization Settings
- Select the Audit Log Streams tab
-
Click Add Log Stream
Select Provider
If your log provider is included in this list, select it. Otherwise click on Custom to input your own Endpoint URL and headers.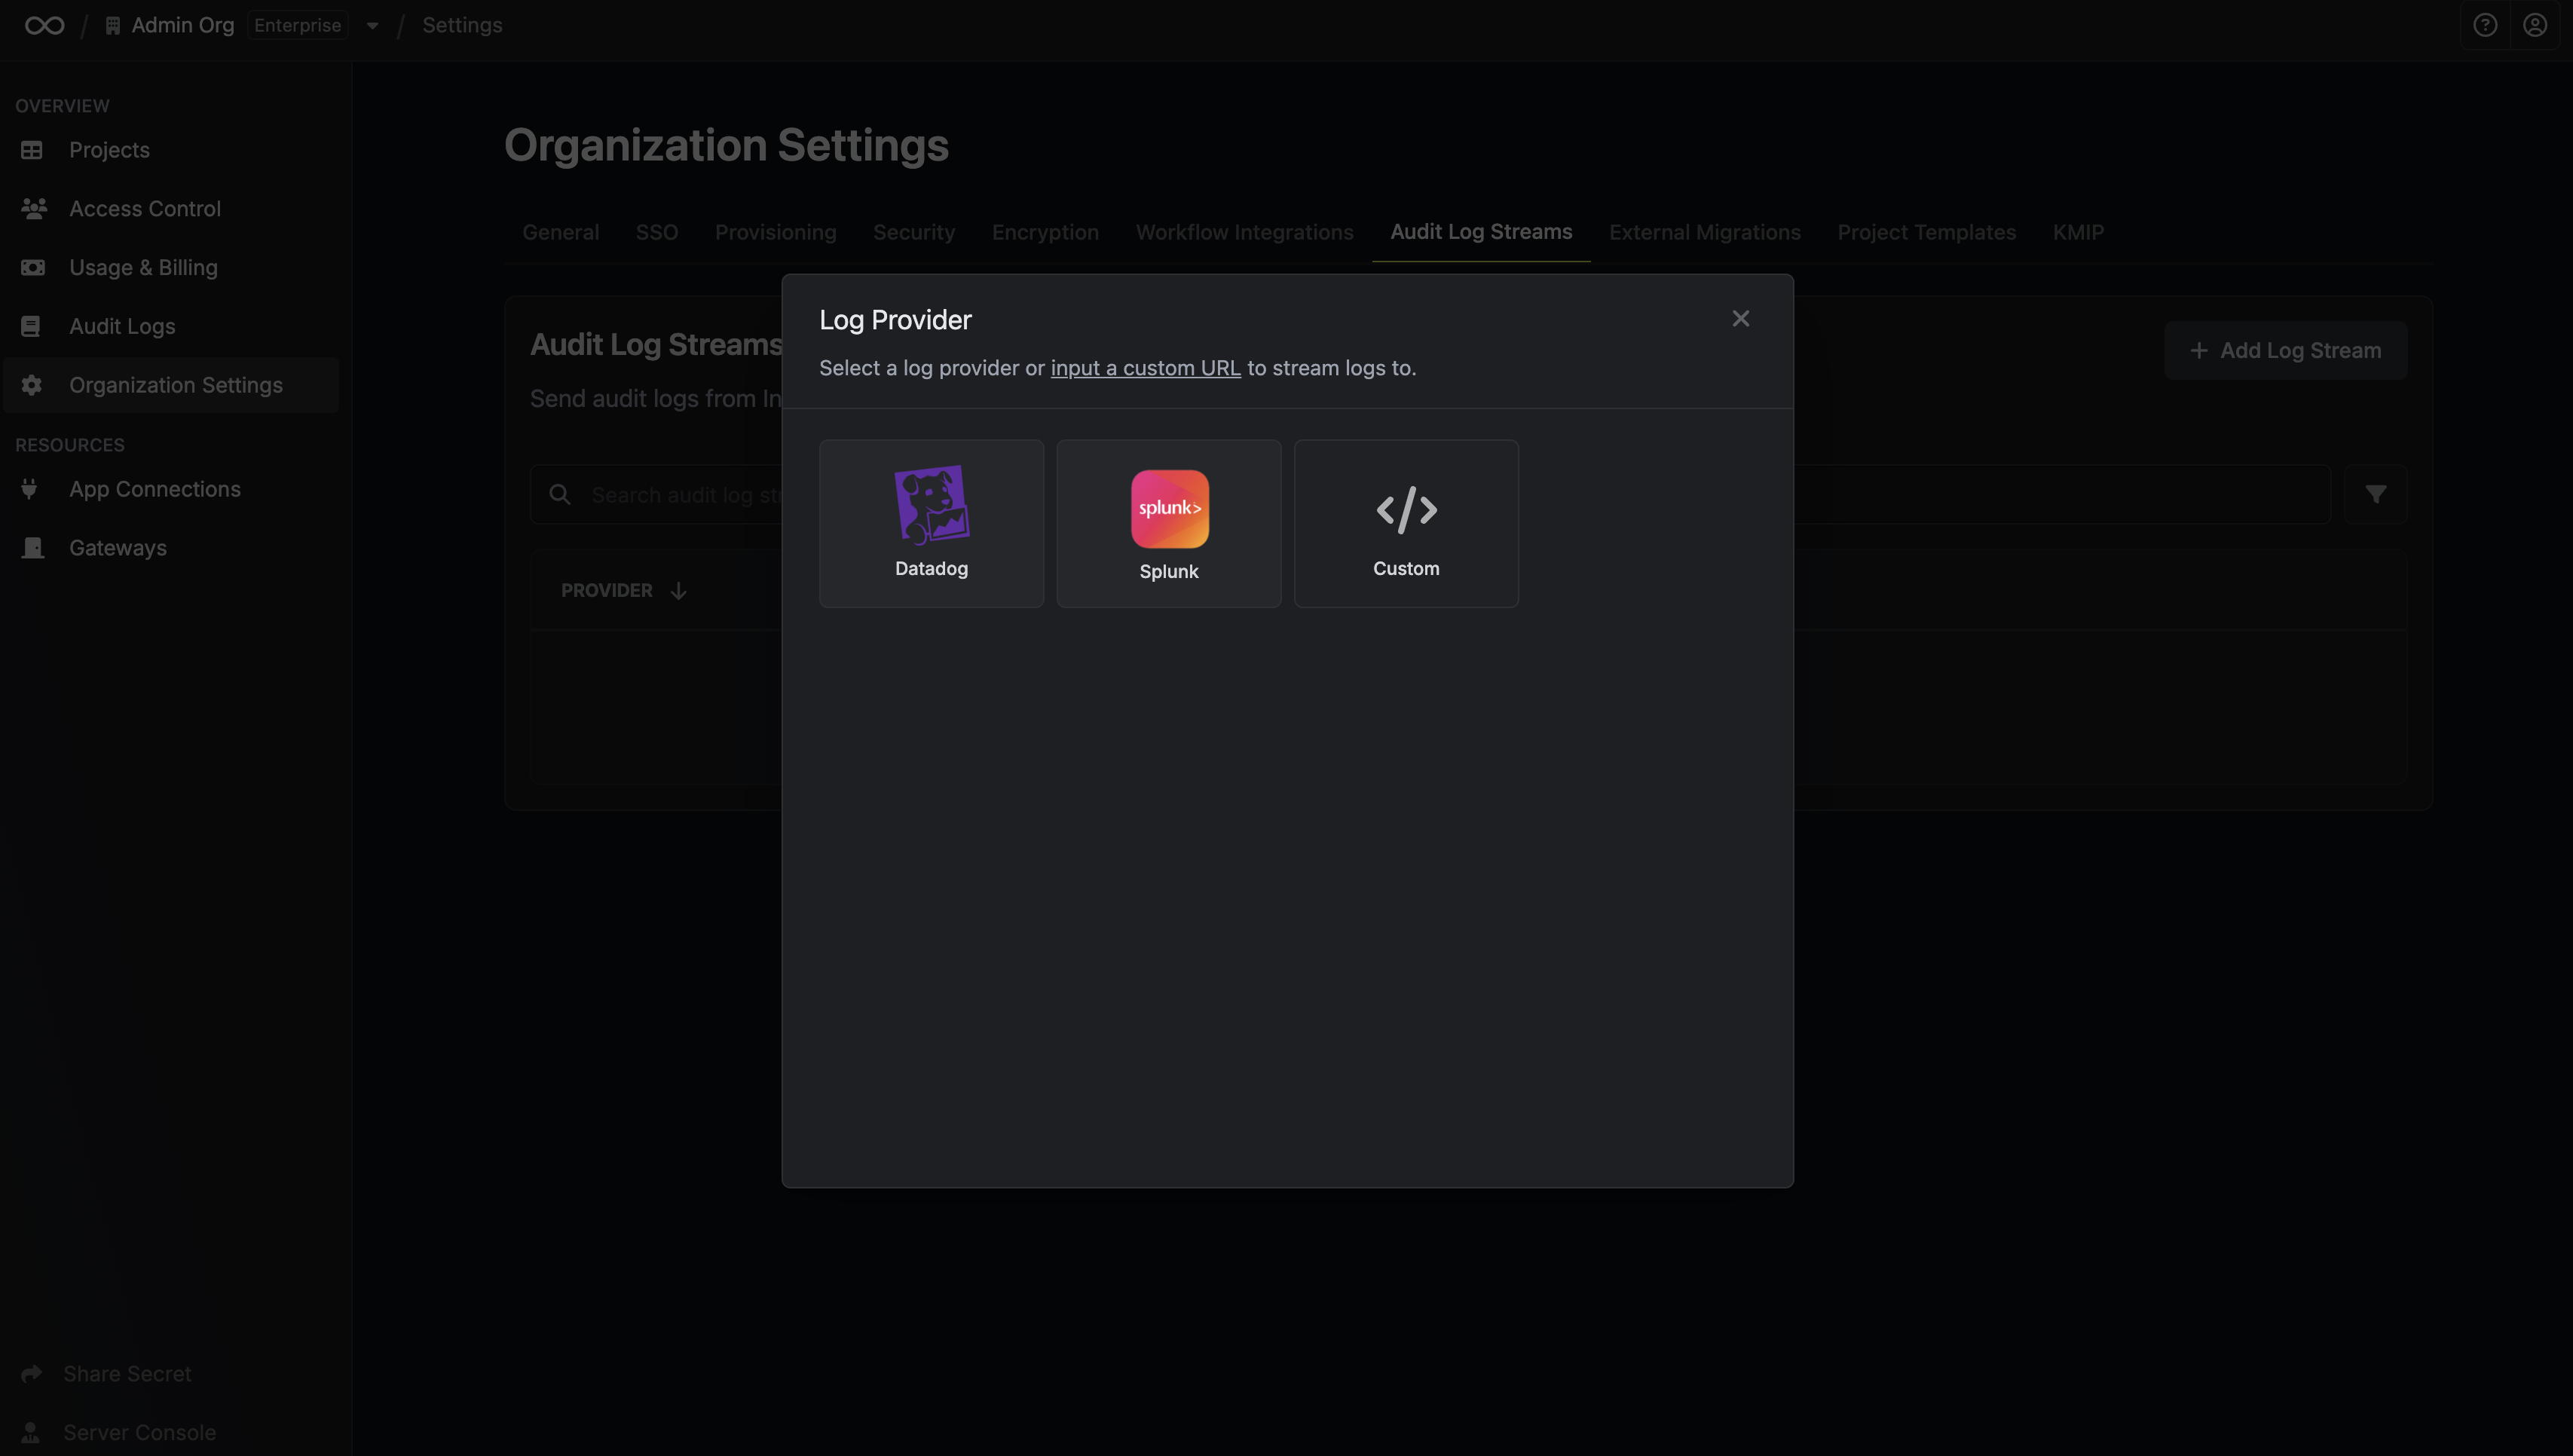
Input Credentials
Depending on your chosen provider, you’ll be asked to input different credentials.For Custom, you need to input an endpoint URL and headers.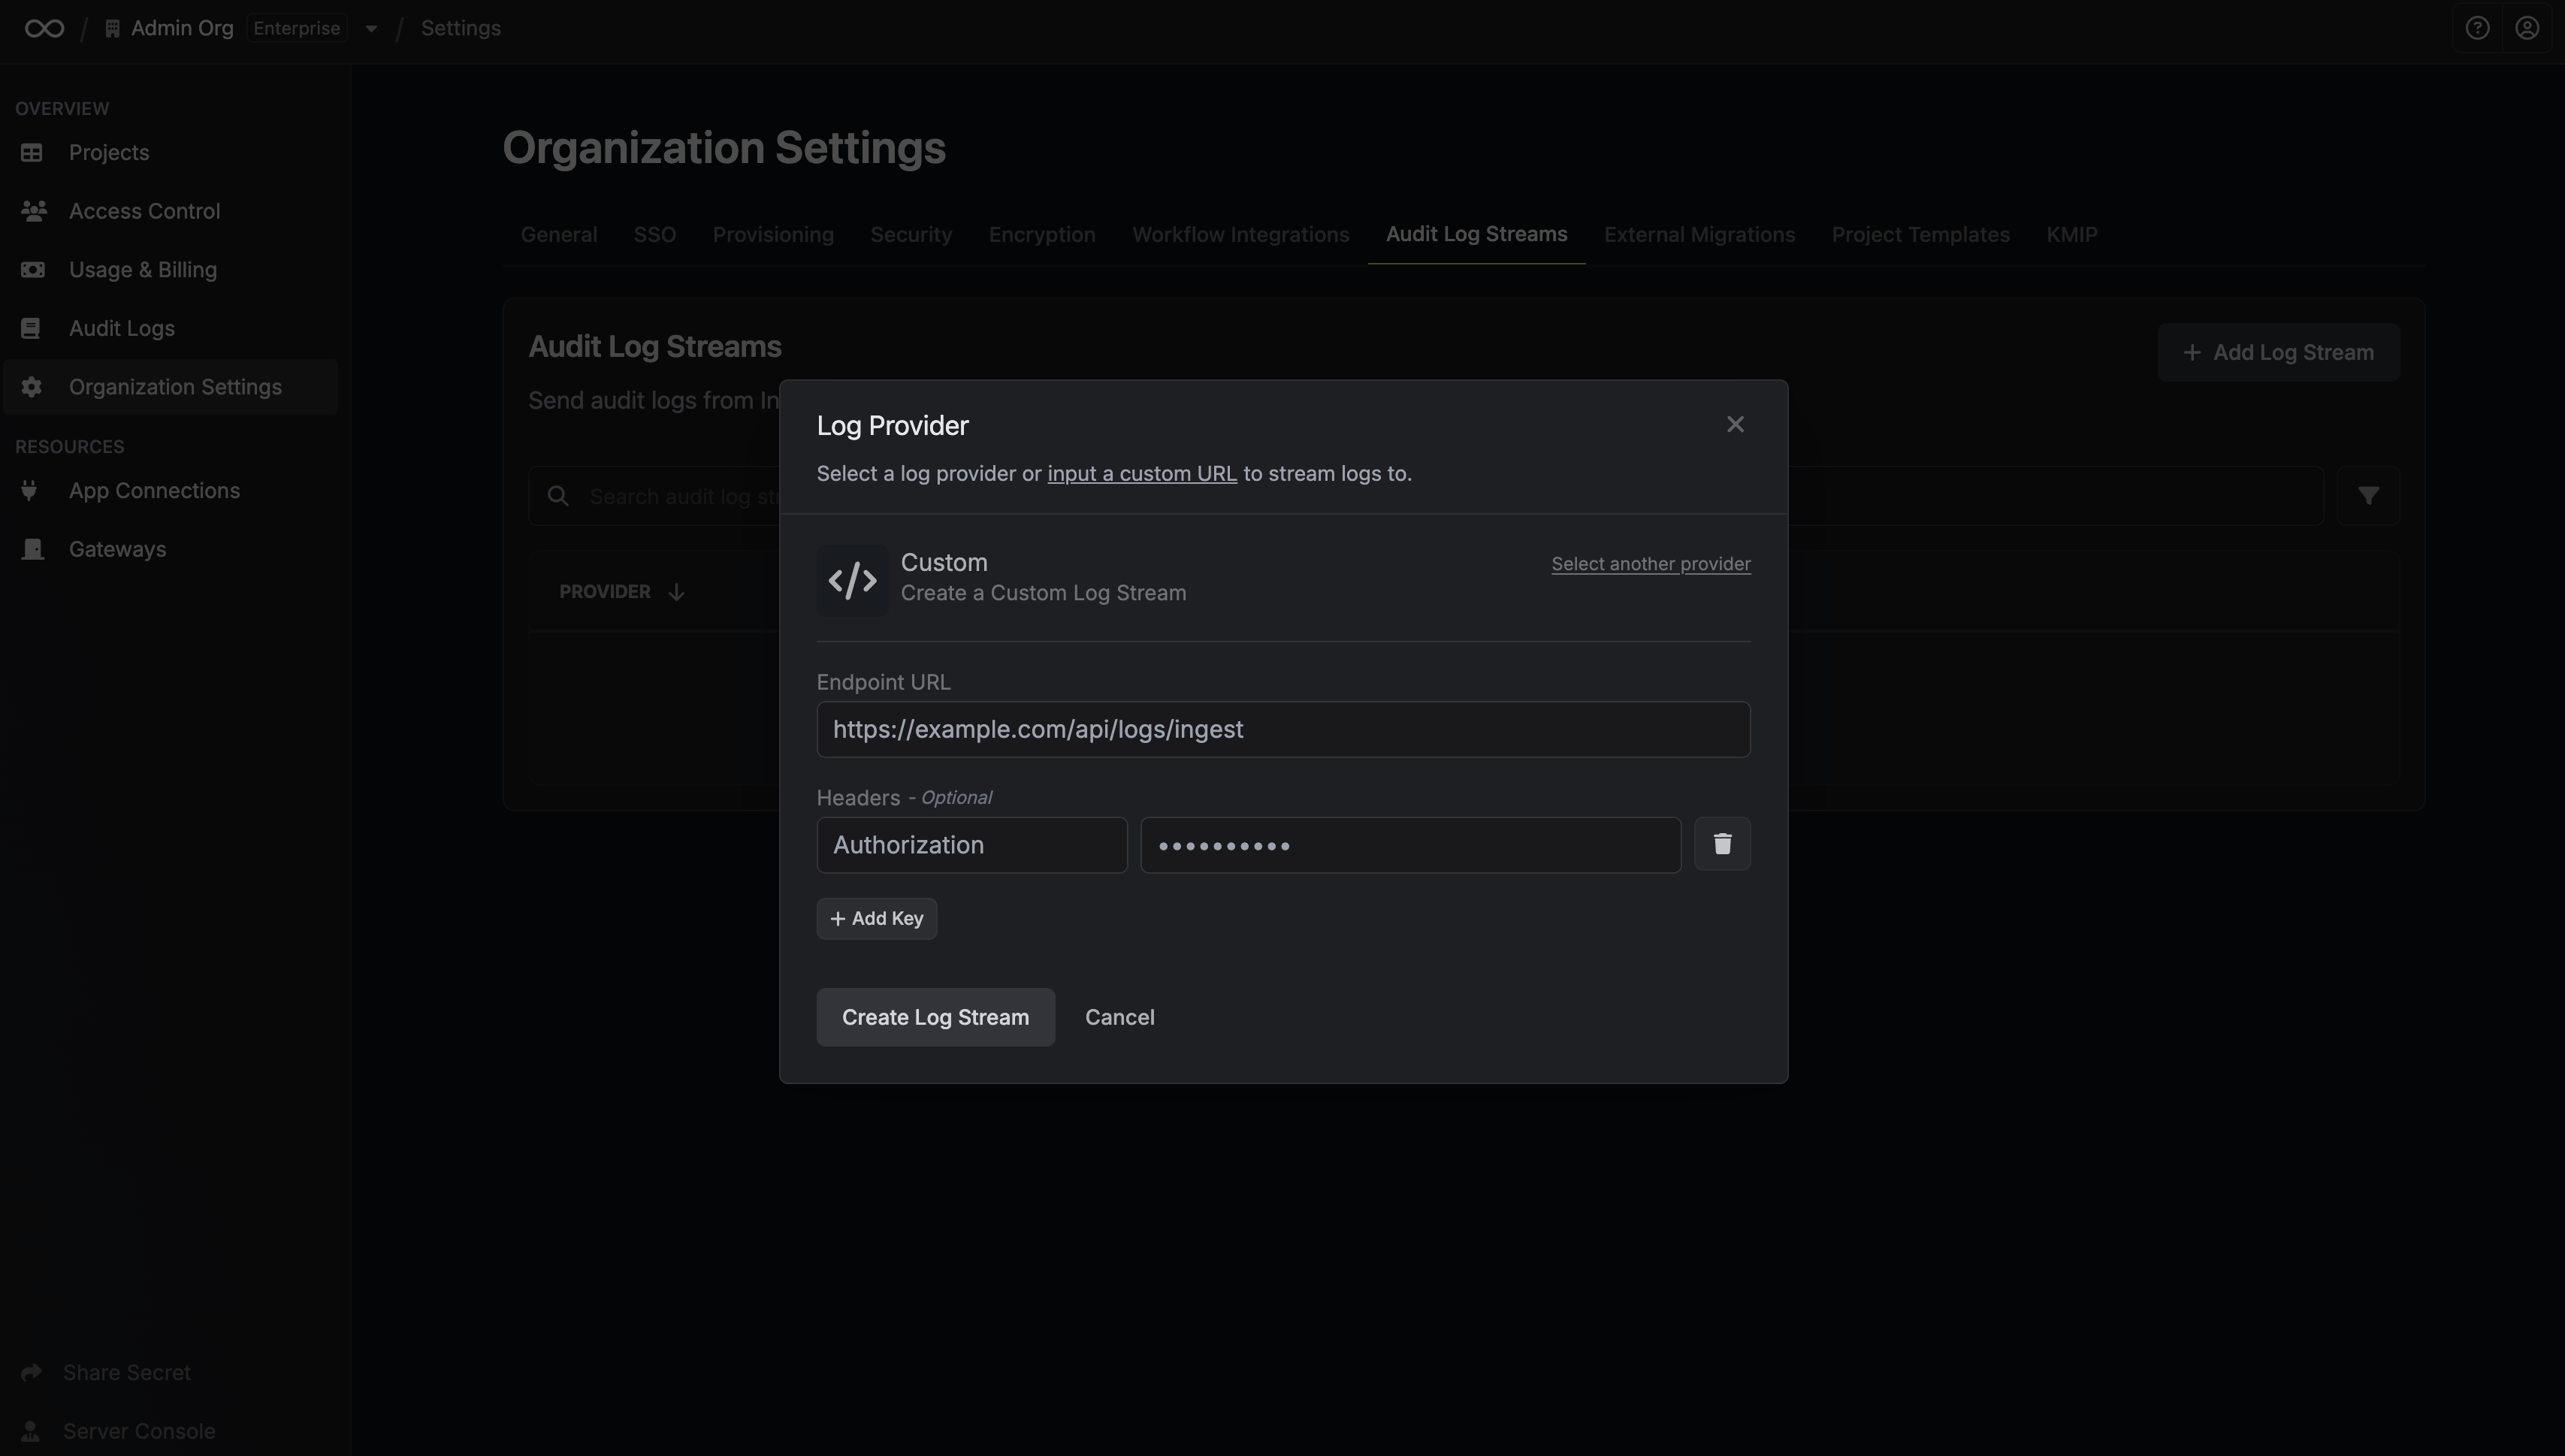 Once you’re finished, click Create Log Stream.
Custom endpoints receive audit logs as a JSON array of events per request (batch delivery). Make sure your receiver accepts an array. See Delivery Format for details.
Example Providers
Azure
Azure
Infisical offers a dedicated Azure provider to stream your audit logs, enabling seamless integration with services like Microsoft Sentinel.Navigate to Log Analytics Workspaces and click Create.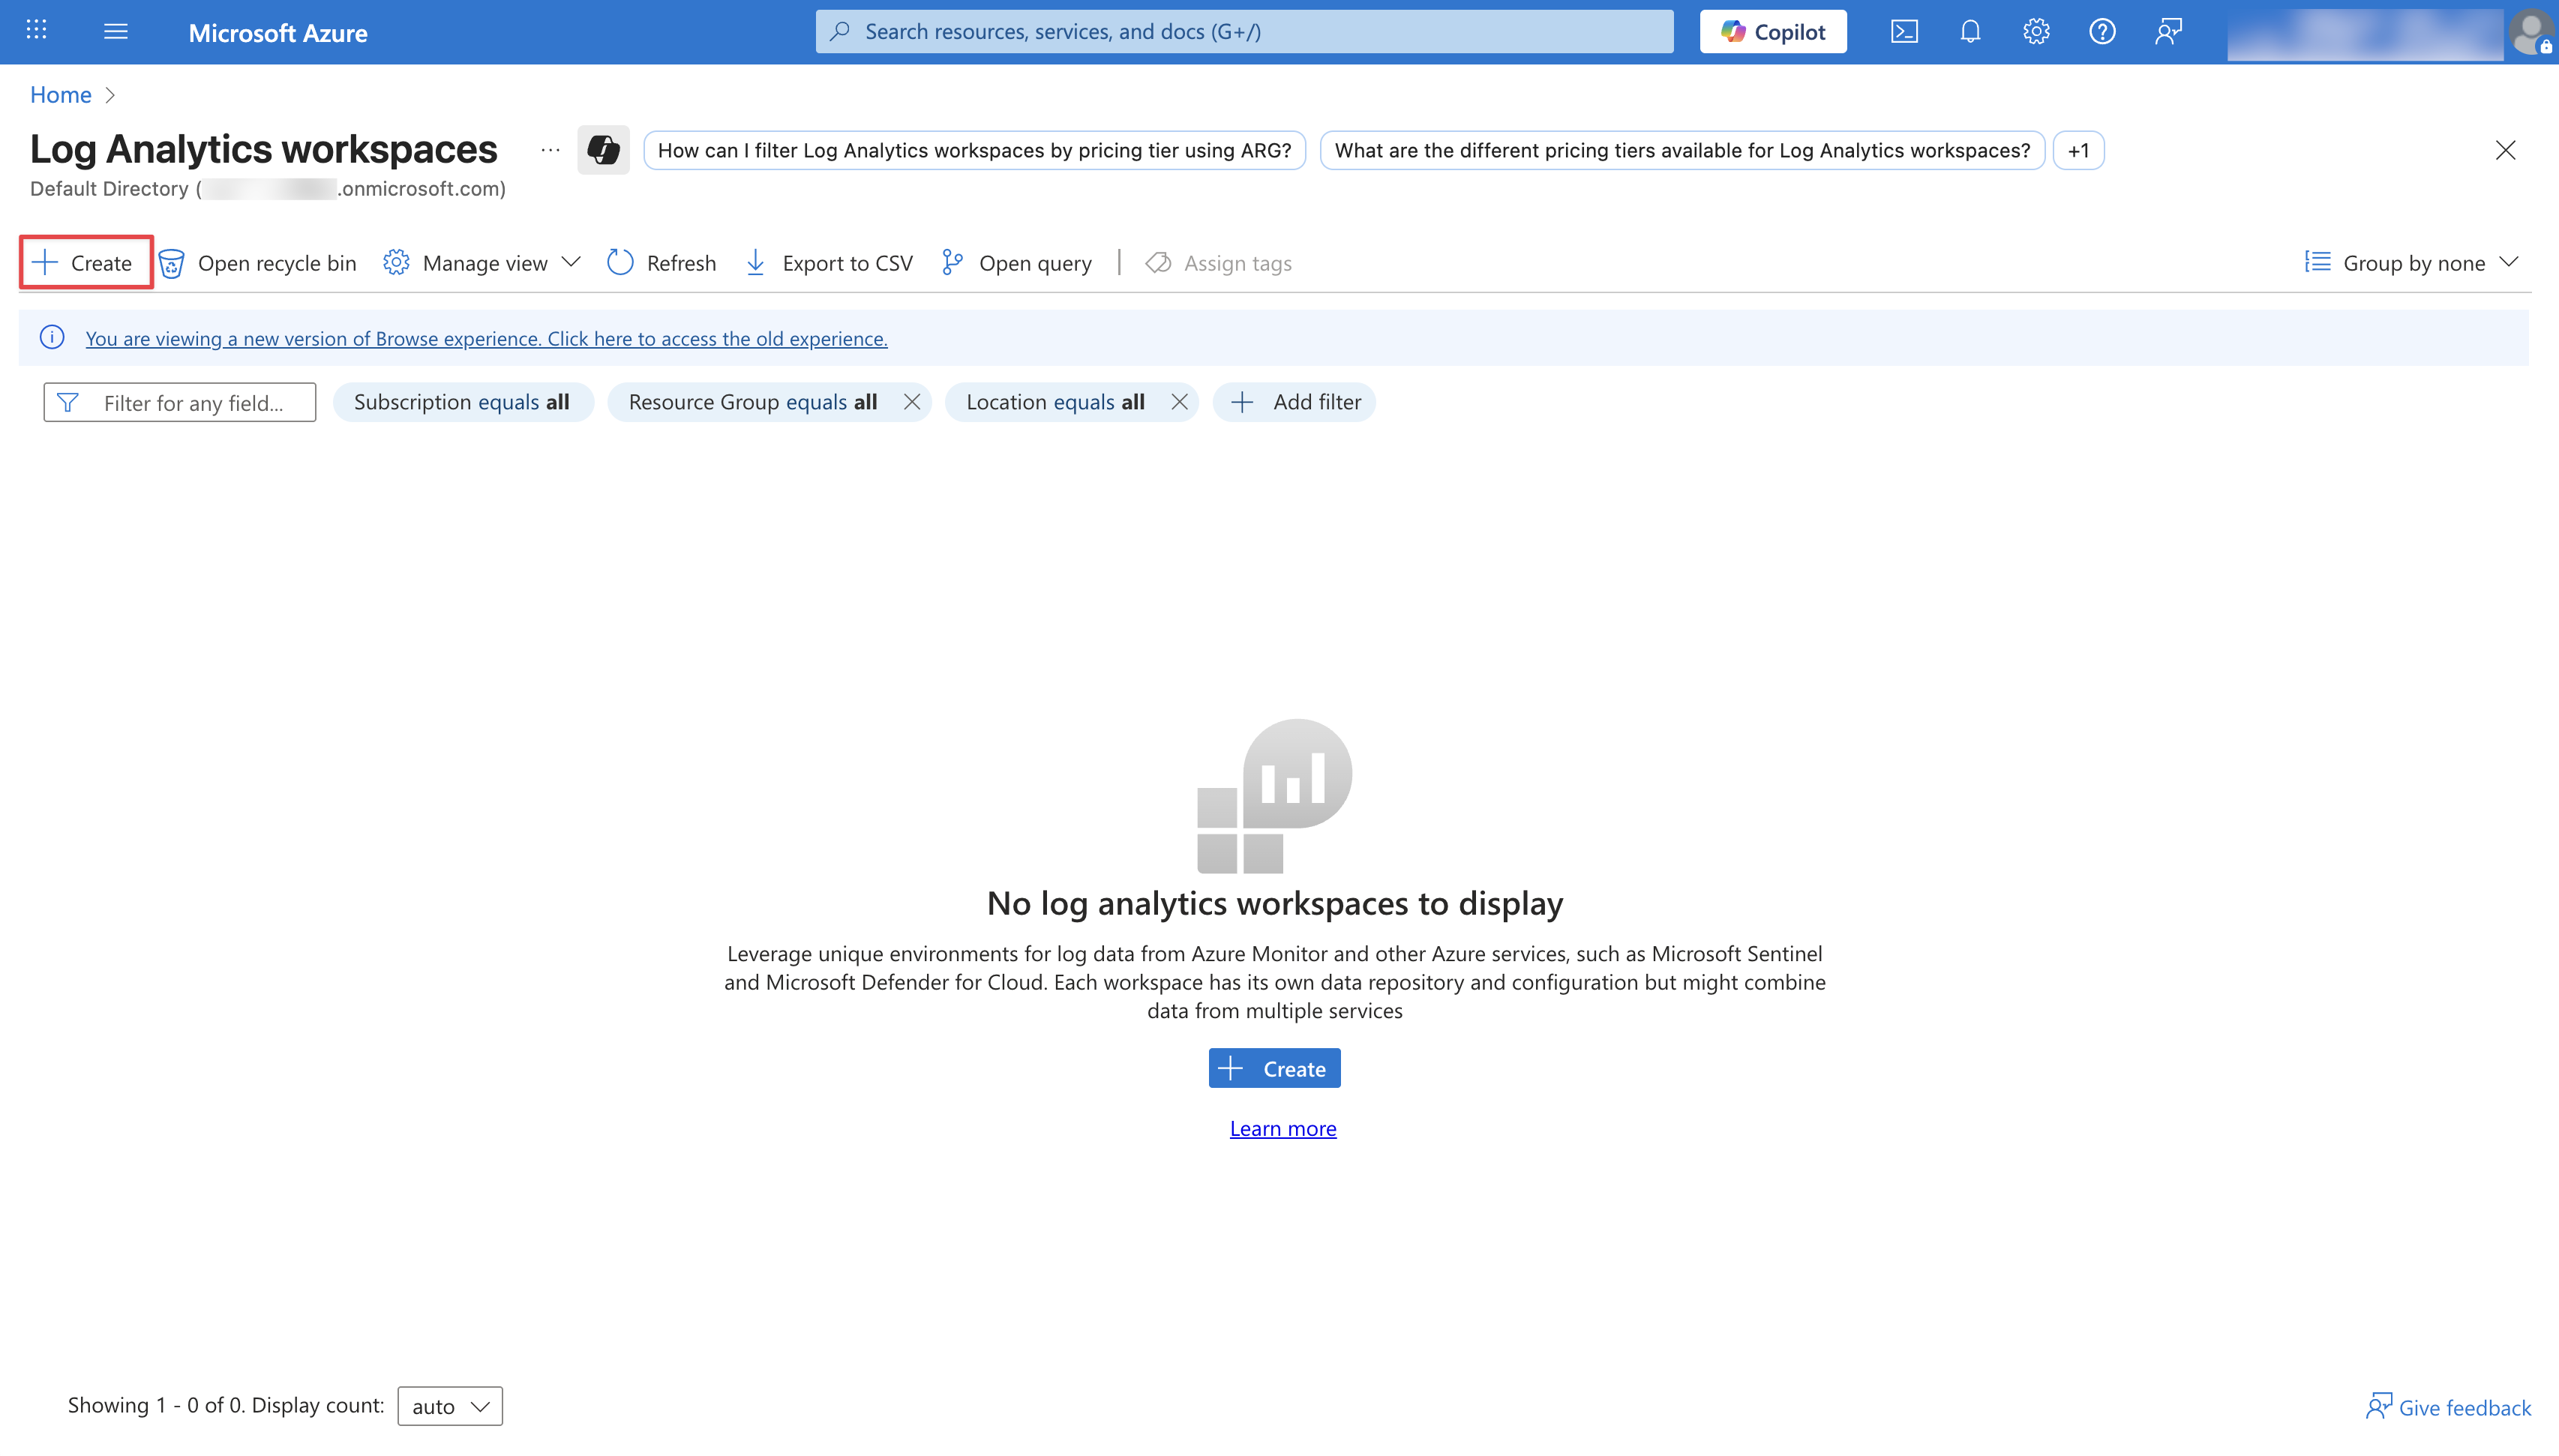 Configure your Log Analytics Workspace by providing a Subscription, Resource group, and a Name. Then click Review + Create.
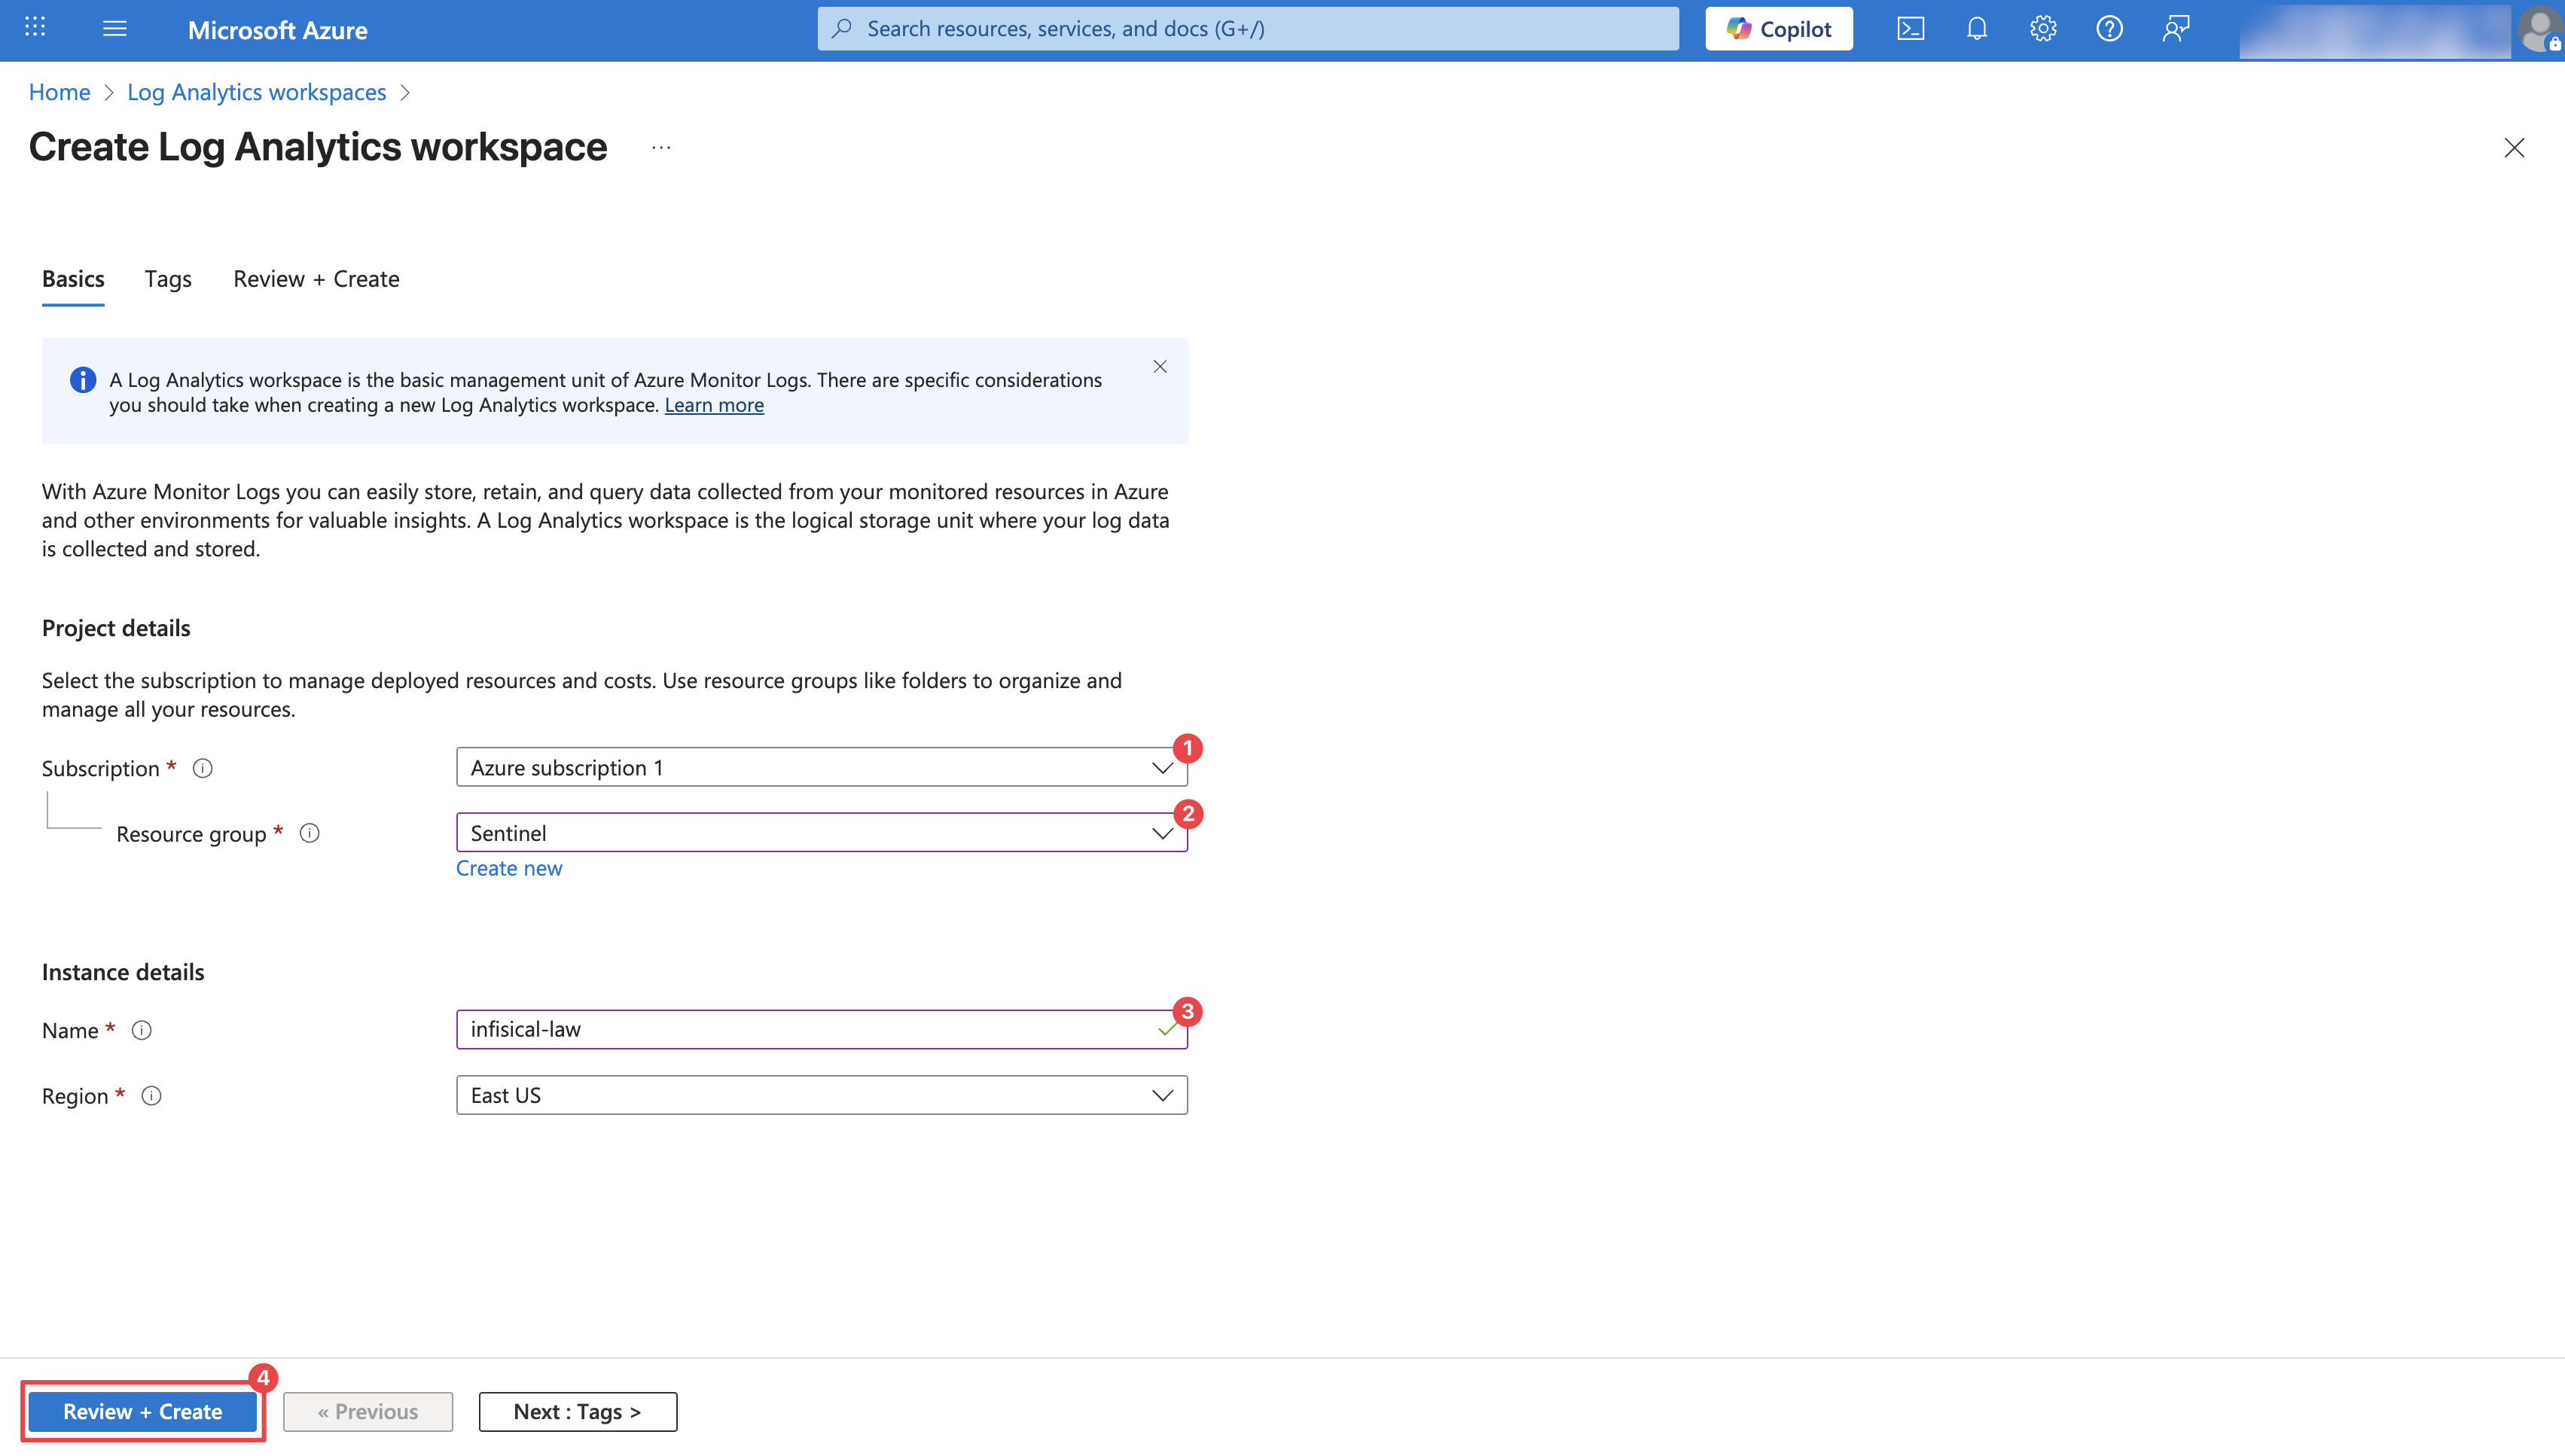 Once the workspace is deployed, click Go to resource to access it.
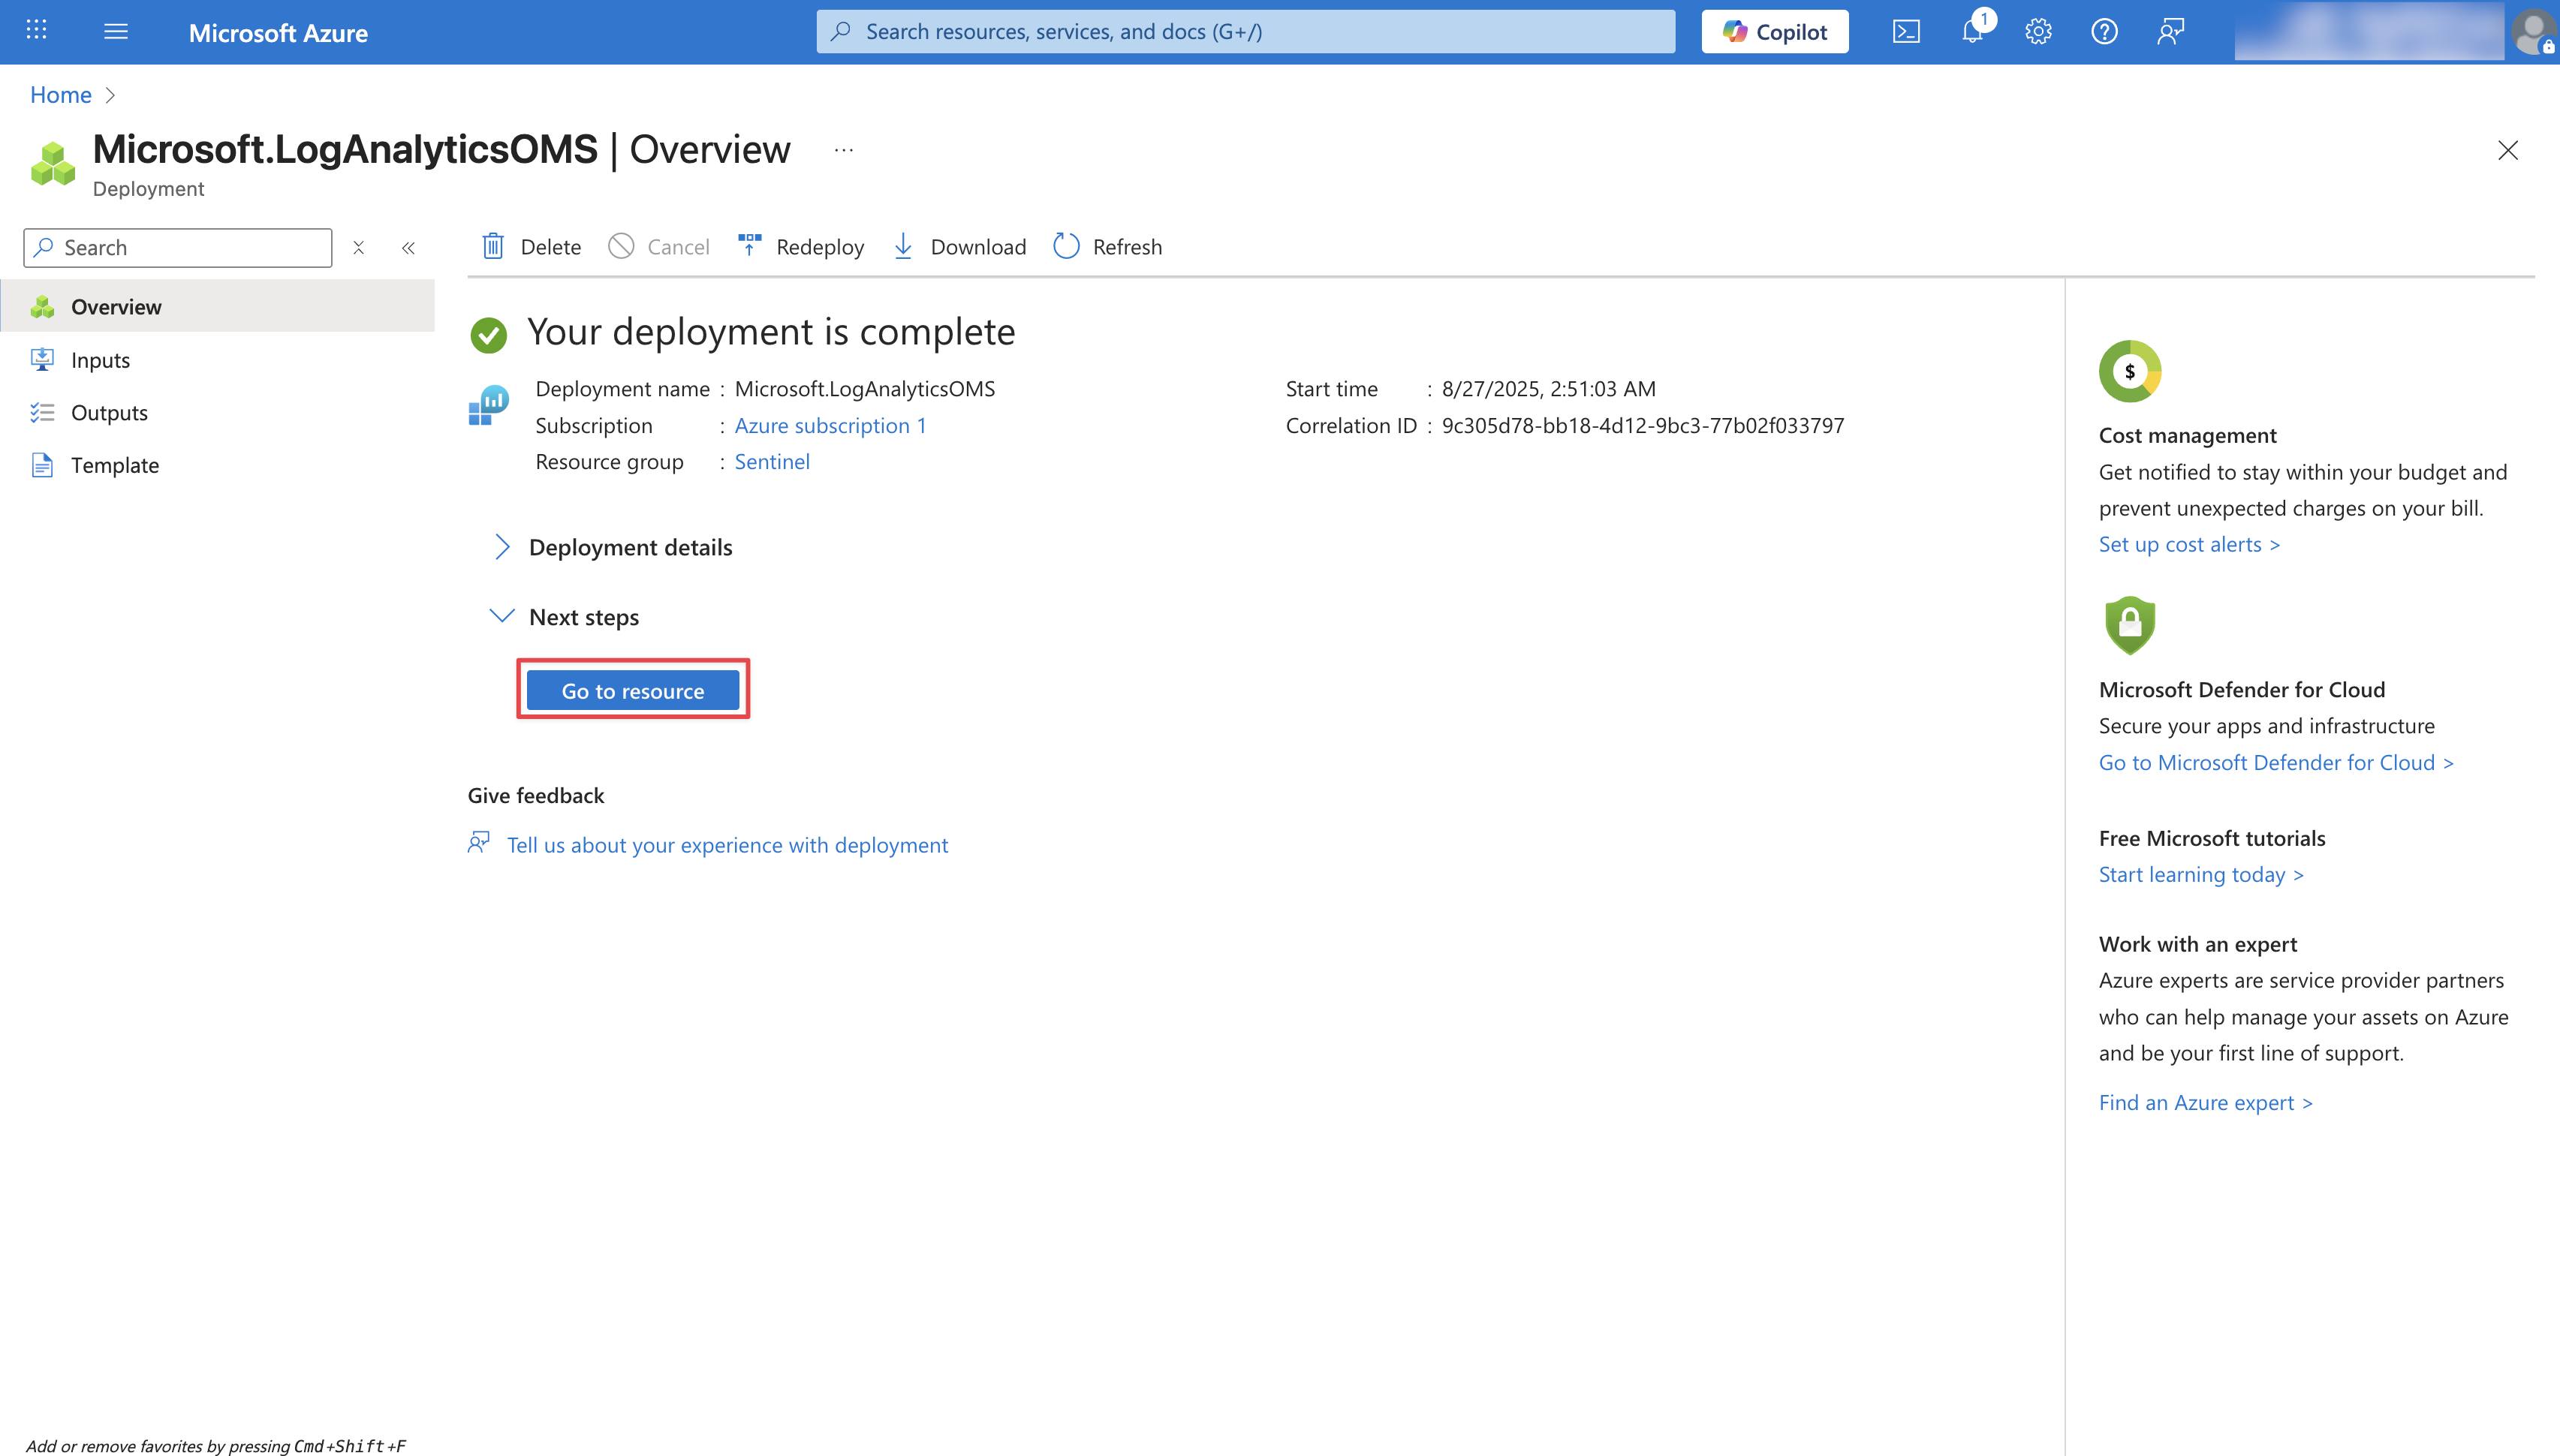
Create a Data Collection Endpoint
Navigate to Data Collection Endpoints and click Create.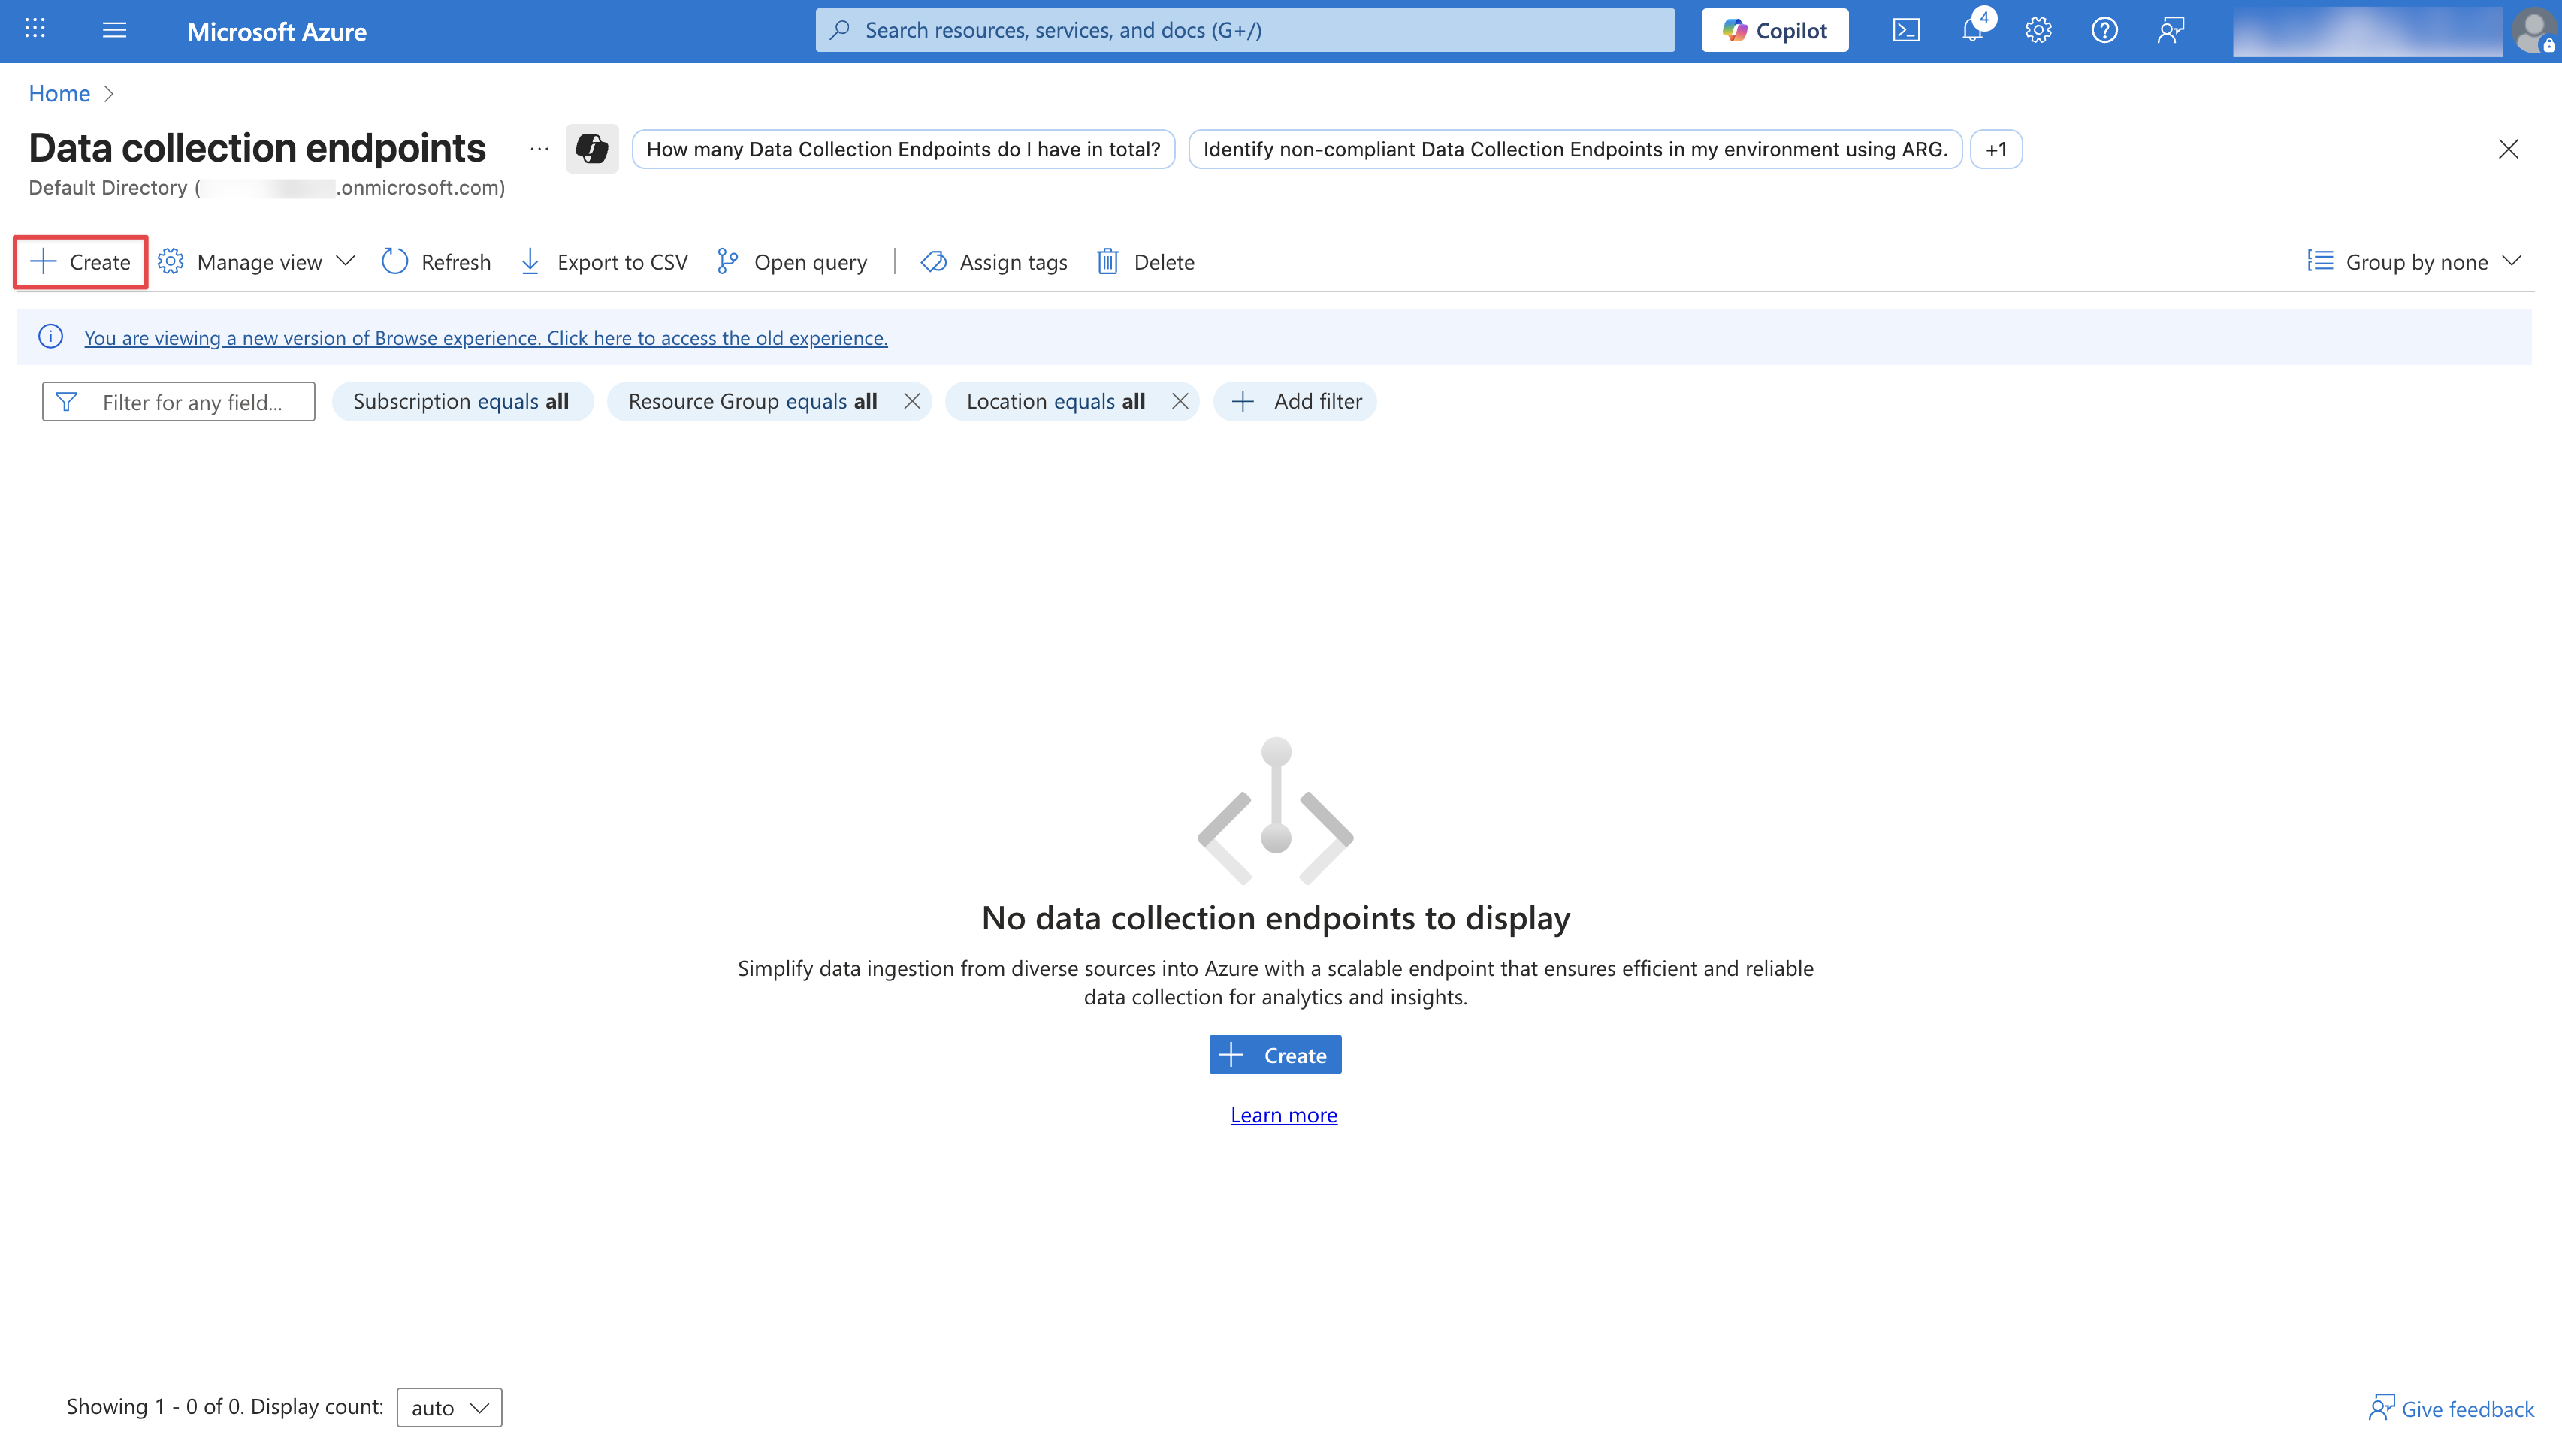 Configure your Data Collection Endpoint by providing an Endpoint Name, Subscription, and a Resource group. Then click Review + Create.
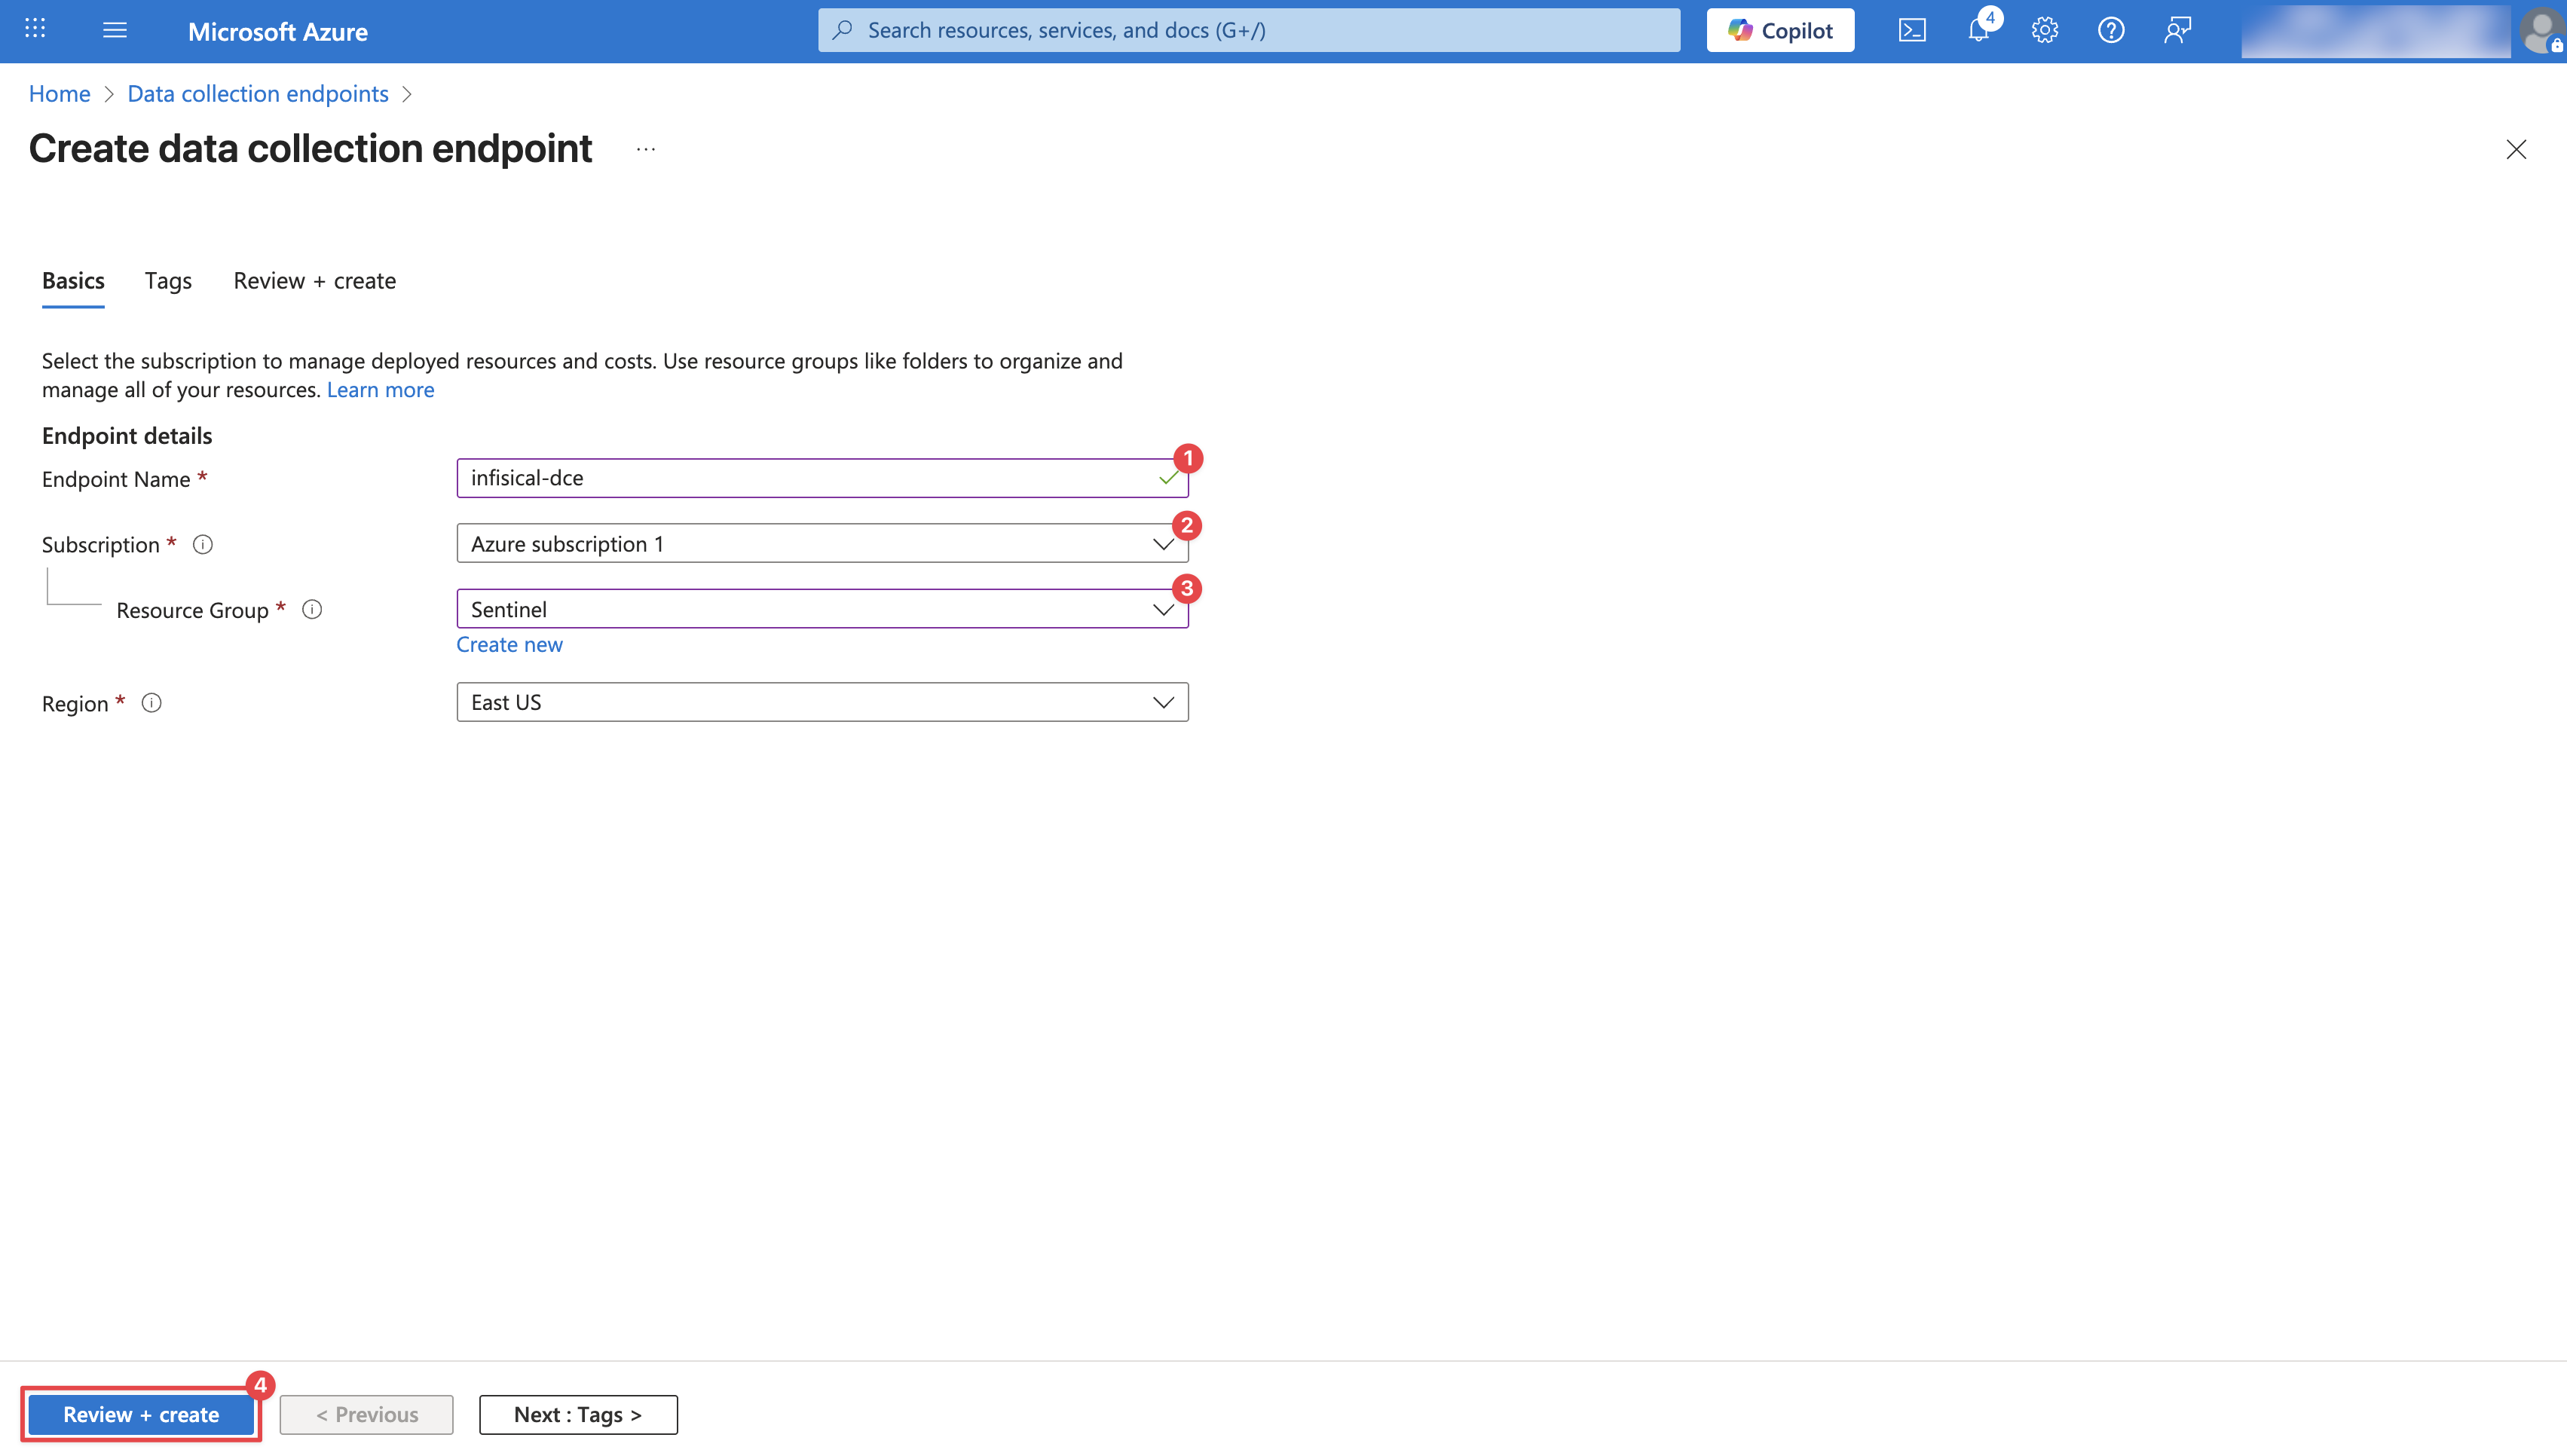 After creation, it may take a few minutes for the Data Collection Endpoint to appear. Once visible, click on it and copy the Logs Ingestion URL. You will need this URL in later steps.
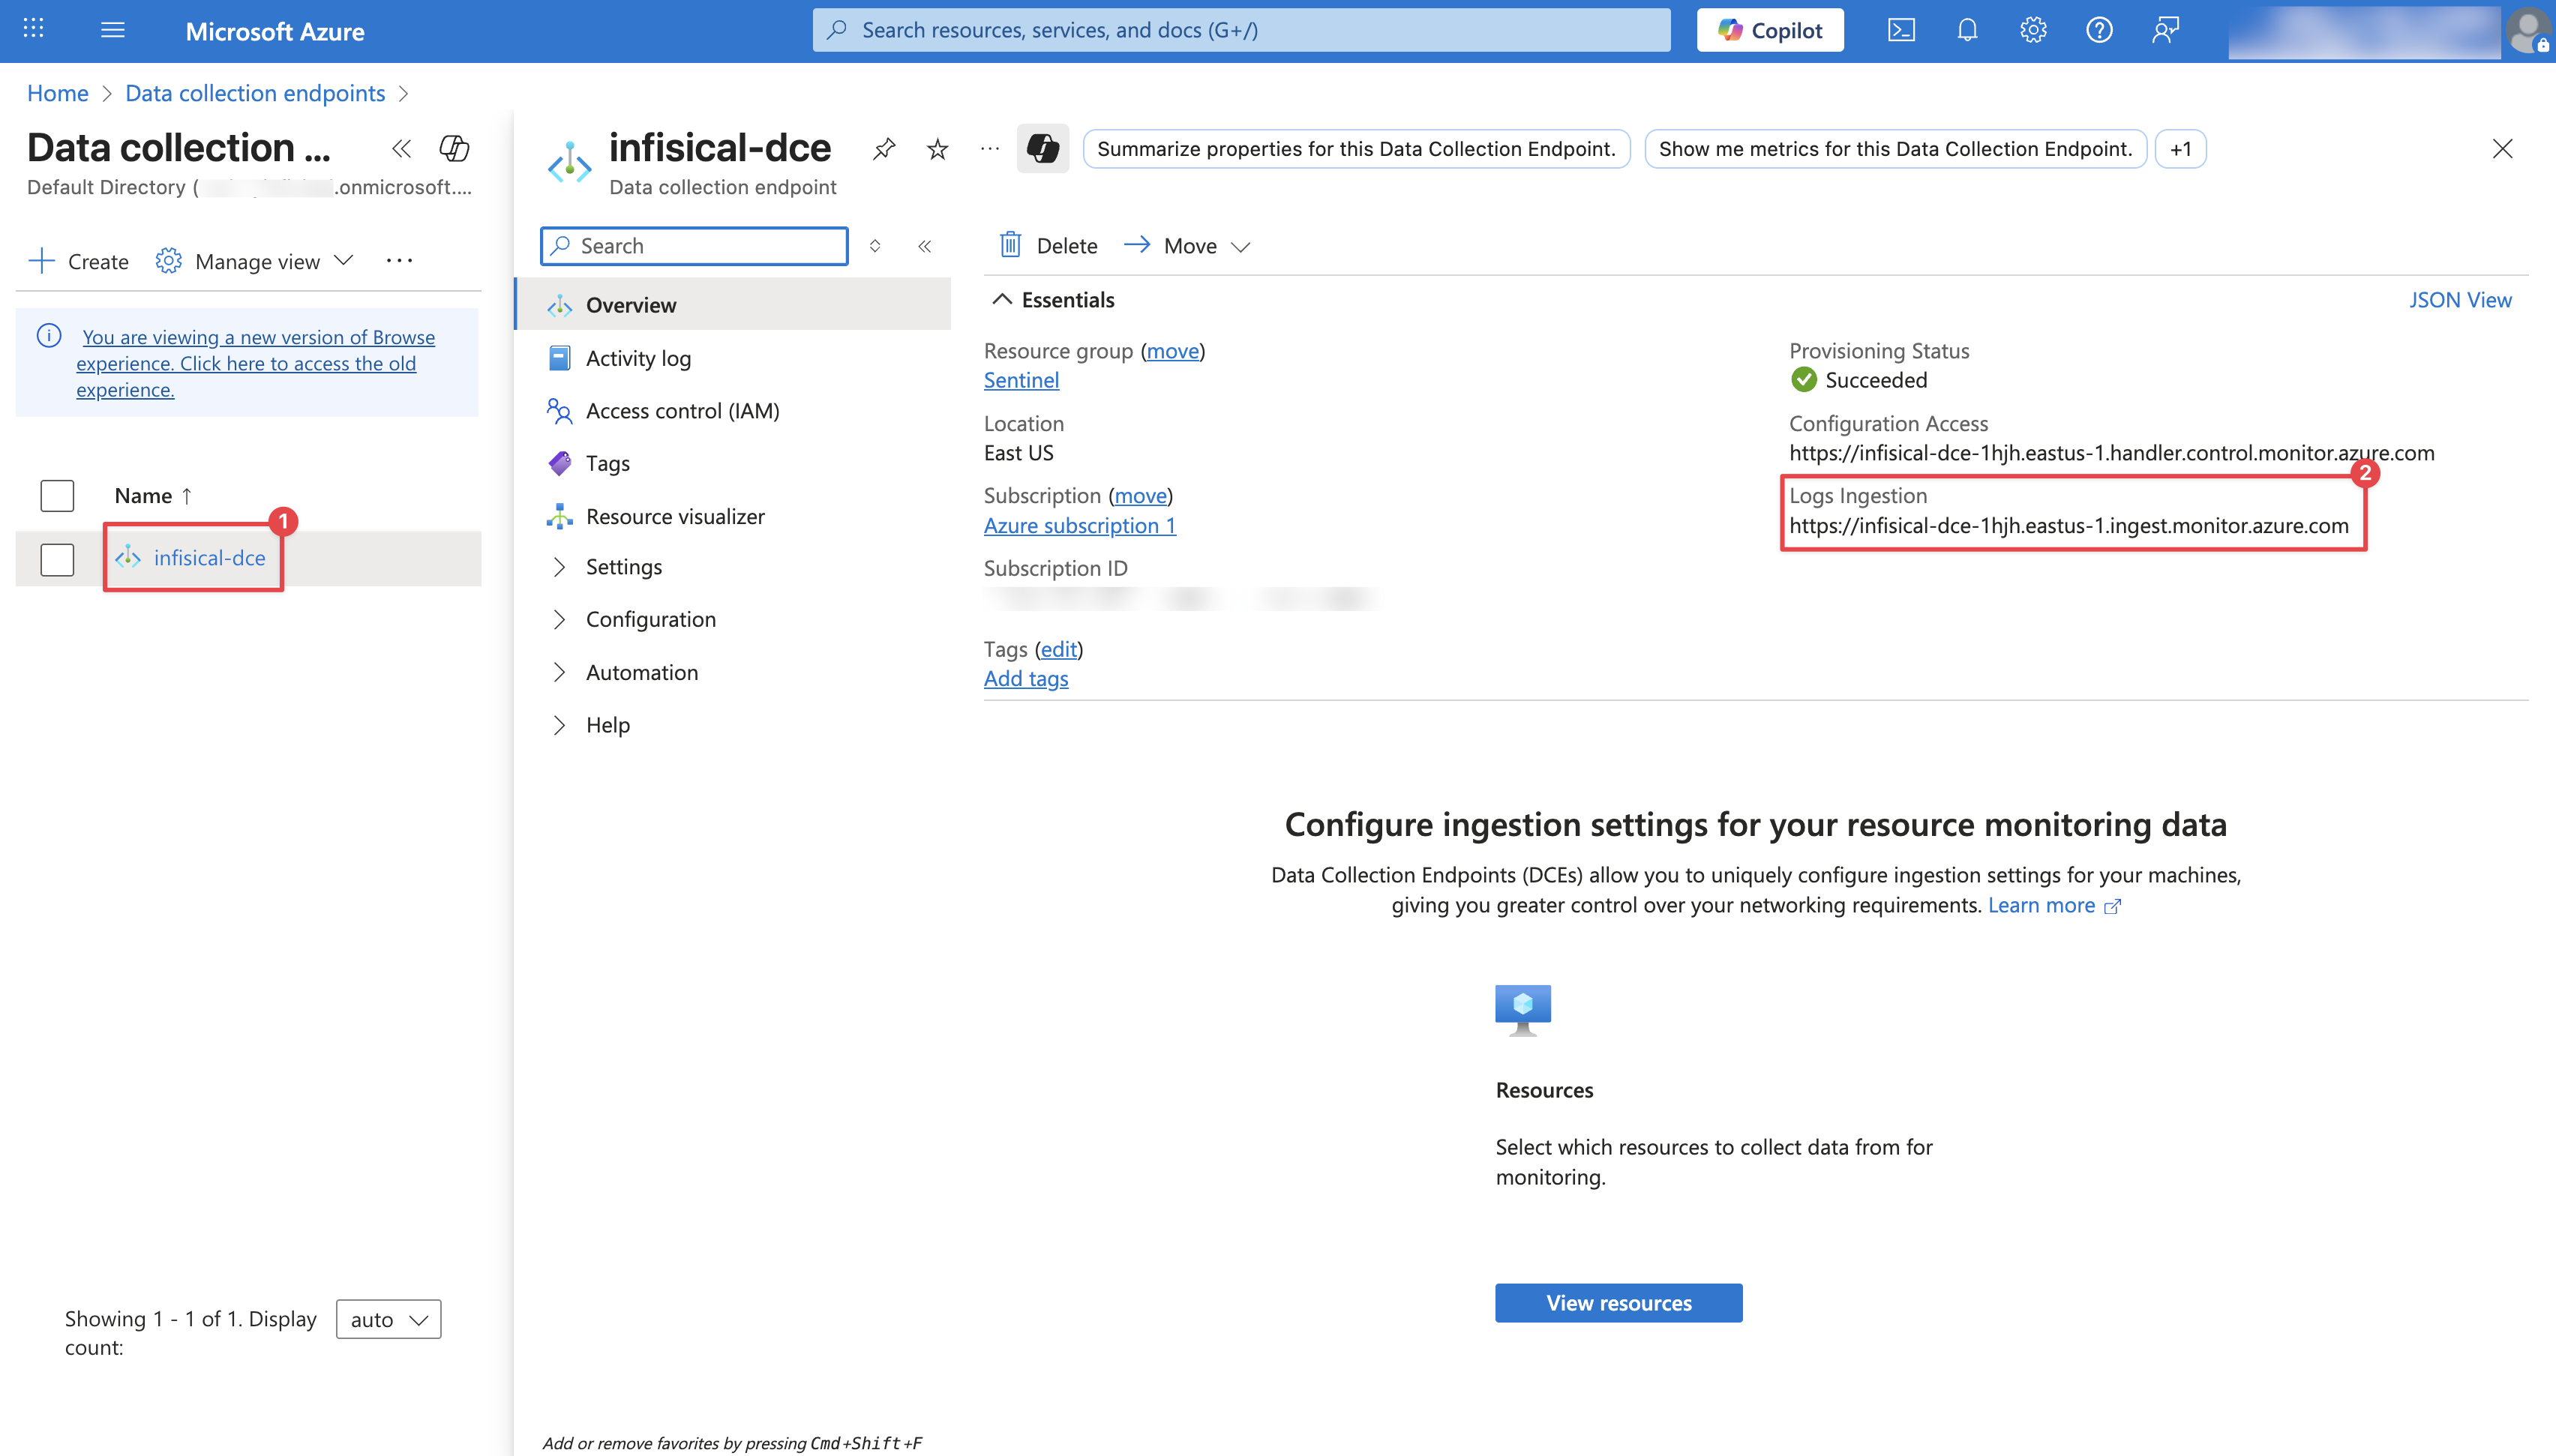
Configure your Data Collection Endpoint by providing an Endpoint Name, Subscription, and a Resource group. Then click Review + Create.After creation, it may take a few minutes for the Data Collection Endpoint to appear. Once visible, click on it and copy the Logs Ingestion URL. You will need this URL in later steps.Create a Log Analytics Workspace
If you already have a Log Analytics Workspace, you may skip this step.
Configure your Log Analytics Workspace by providing a Subscription, Resource group, and a Name. Then click Review + Create.Once the workspace is deployed, click Go to resource to access it.Create a Custom Log Table
Within your Log Analytics Workspace, navigate to Tables and click Create. Select New custom log (DCR-based) from the dropdown.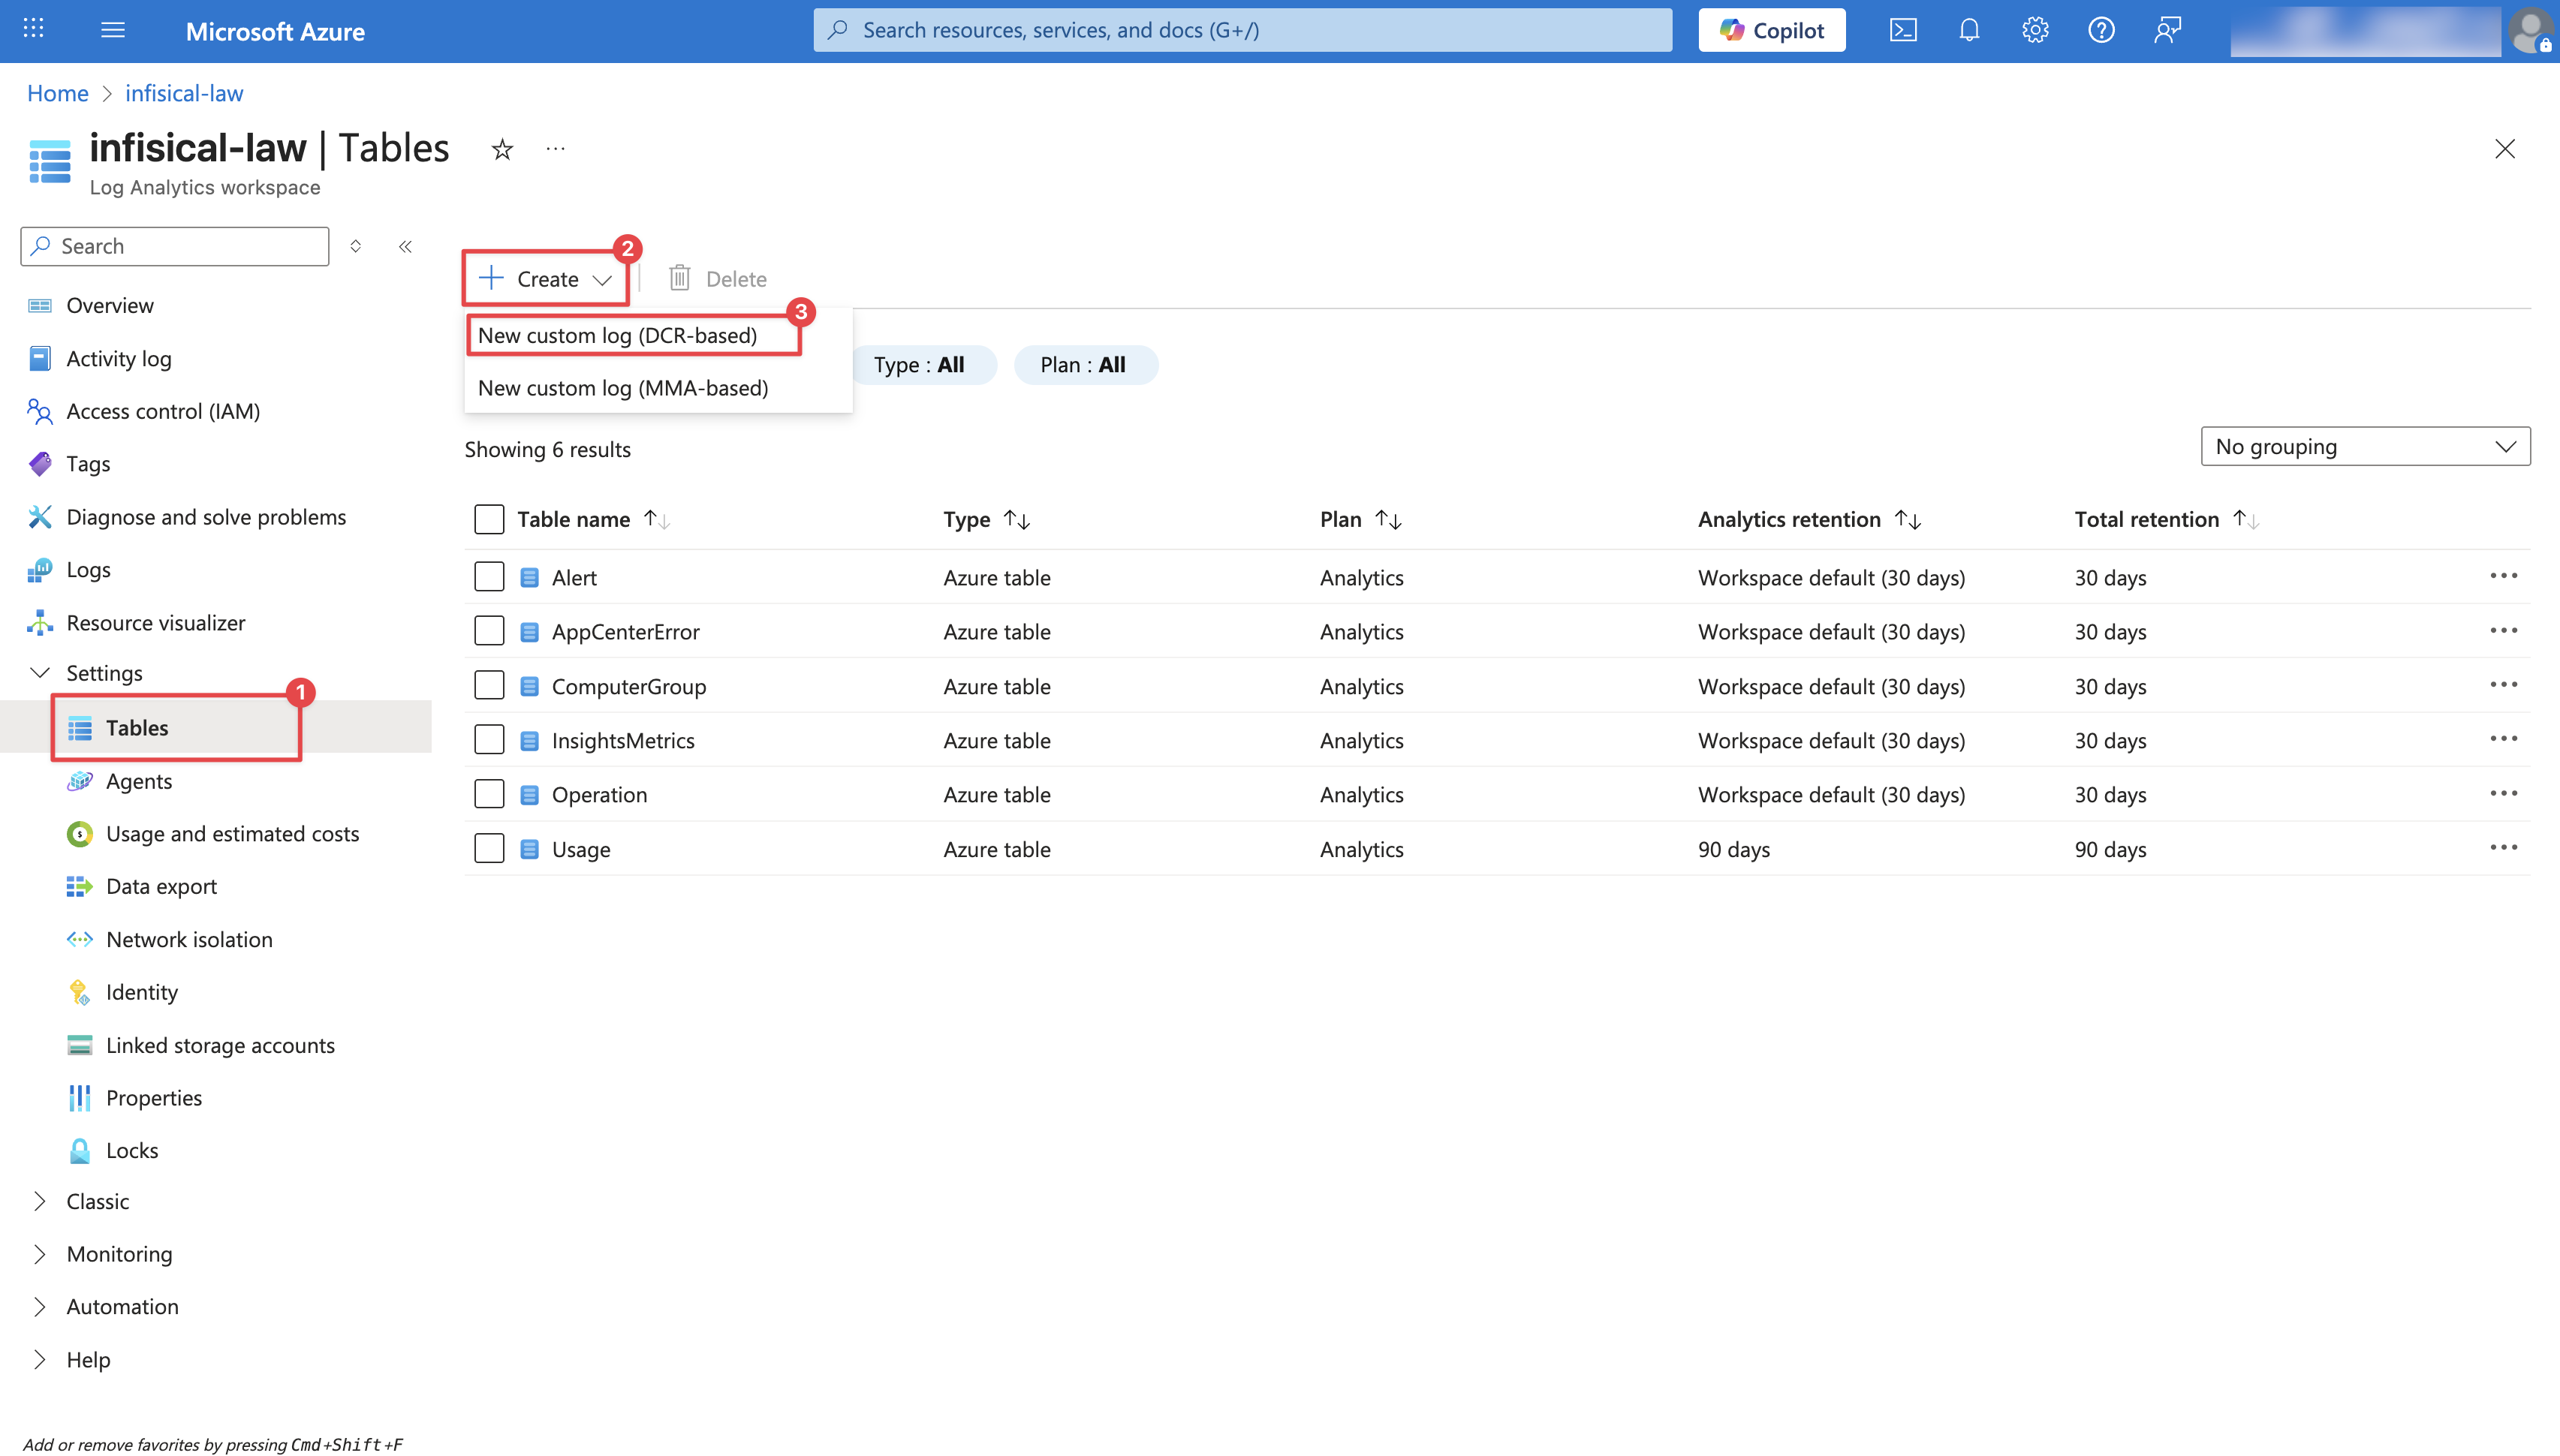 Configure the Custom Log Table: Provide a Table name (e.g.,
 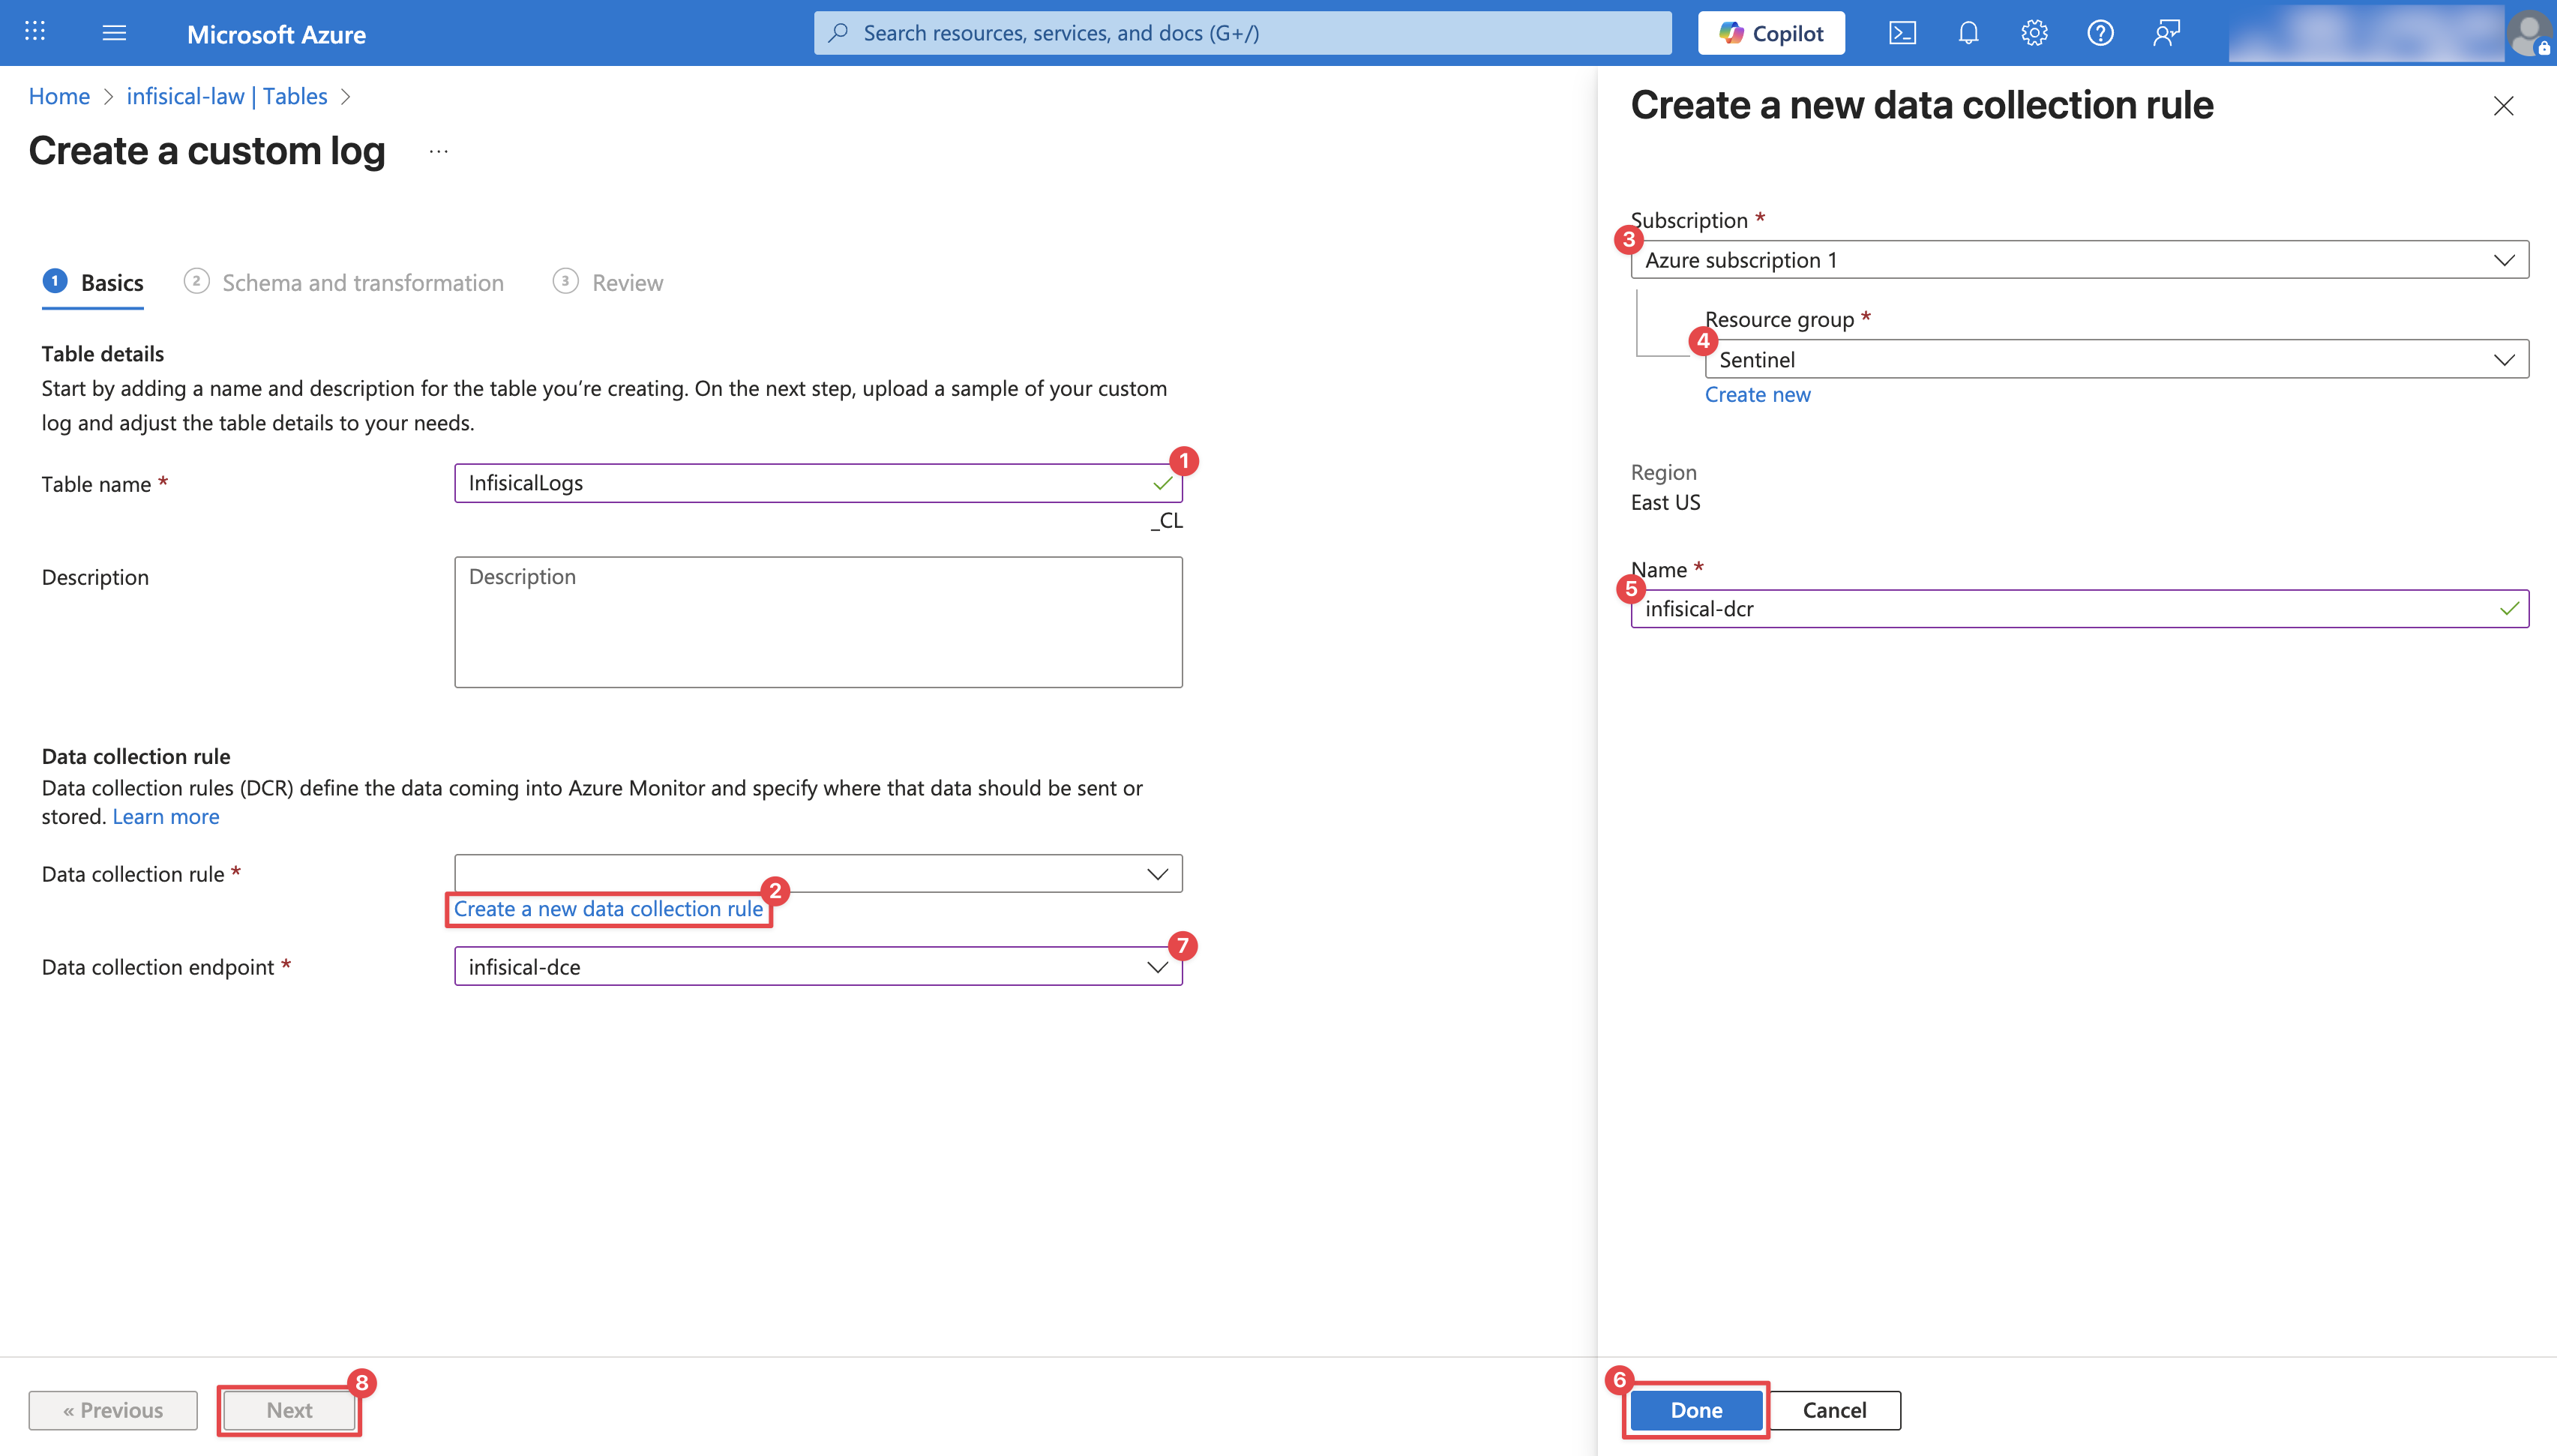 On the Schema and transformation page, you’ll be prompted to upload a Log Sample. Create a Optionally, you can add Transformations to further destructure the data. For example, to extract actor email and userId:On the final step, click Create.
Configure the Custom Log Table: Provide a Table name (e.g., InfisicalLogs), select the Data collection endpoint created in Step 1, and create a new Data collection rule as illustrated in the image below. Then, click Next.On the Schema and transformation page, you’ll be prompted to upload a Log Sample. Create a .json file with the following content and upload it:Obtain Data Collection Rule Immutable ID
After creating your Data Collection Rule, you’ll need its Immutable ID.Navigate to Data collection rules. Click on your newly created DCR and copy its Immutable ID for the next step.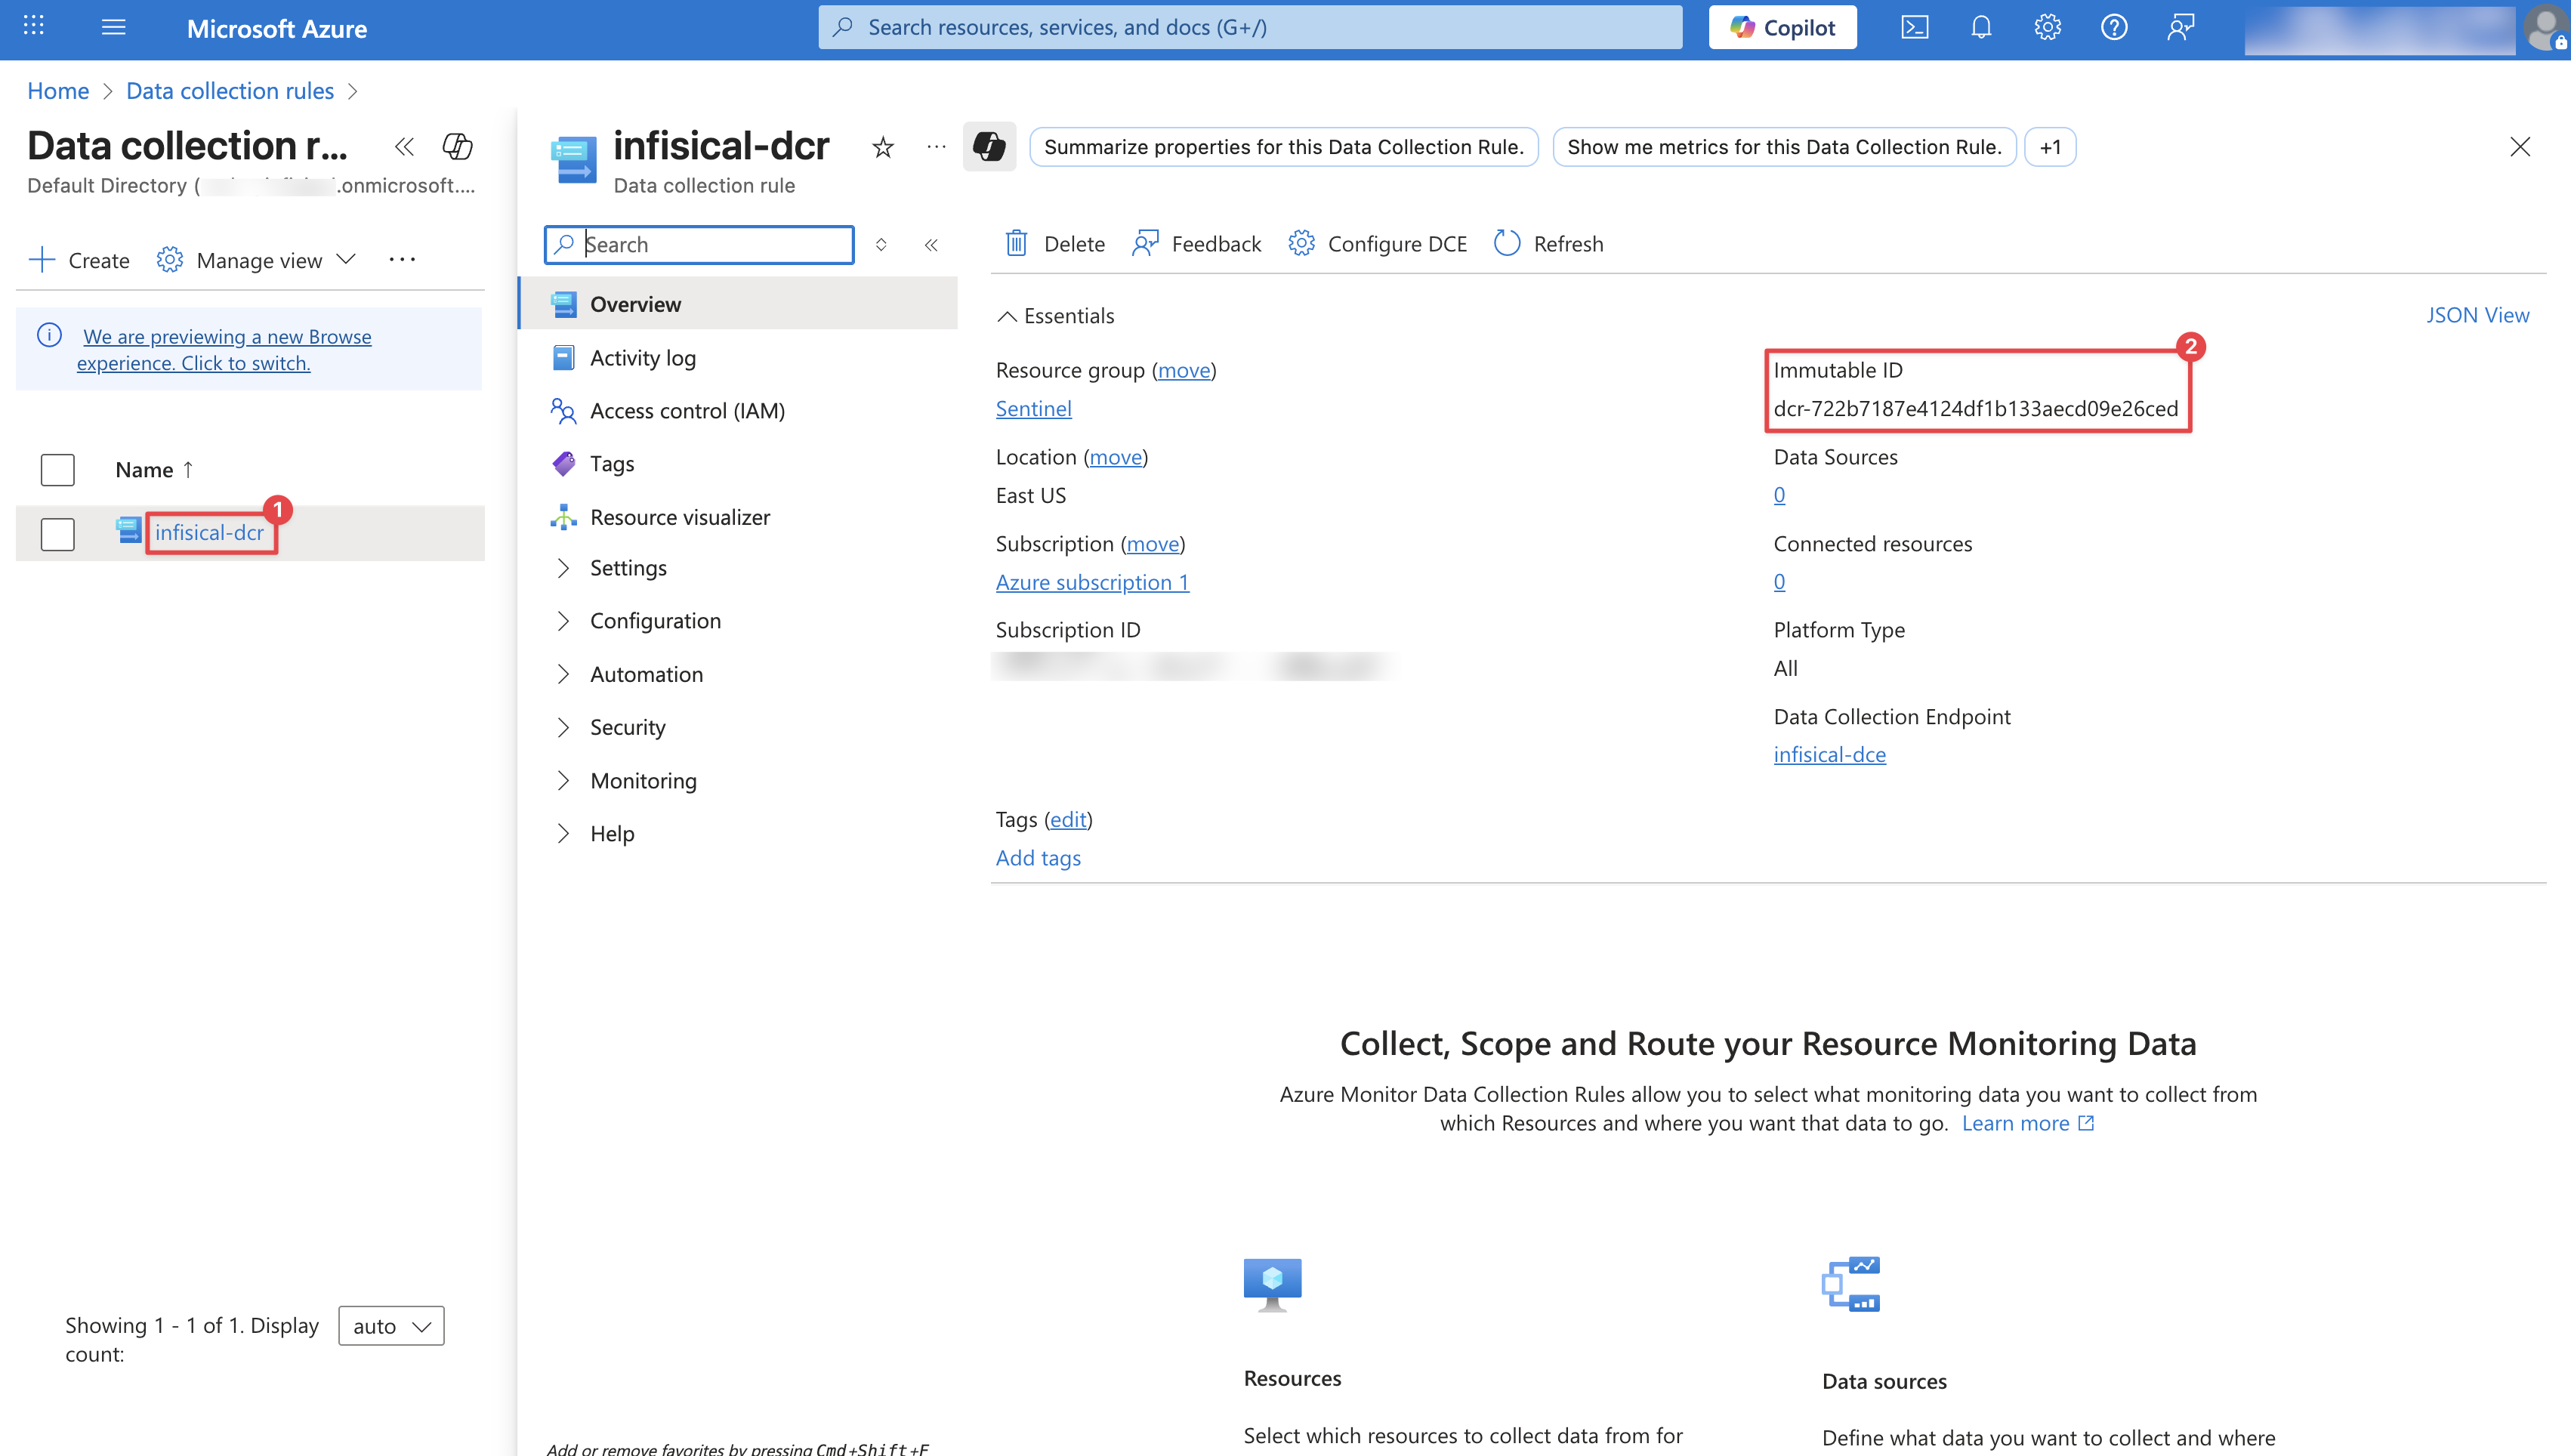
Create Audit Log Stream on Infisical
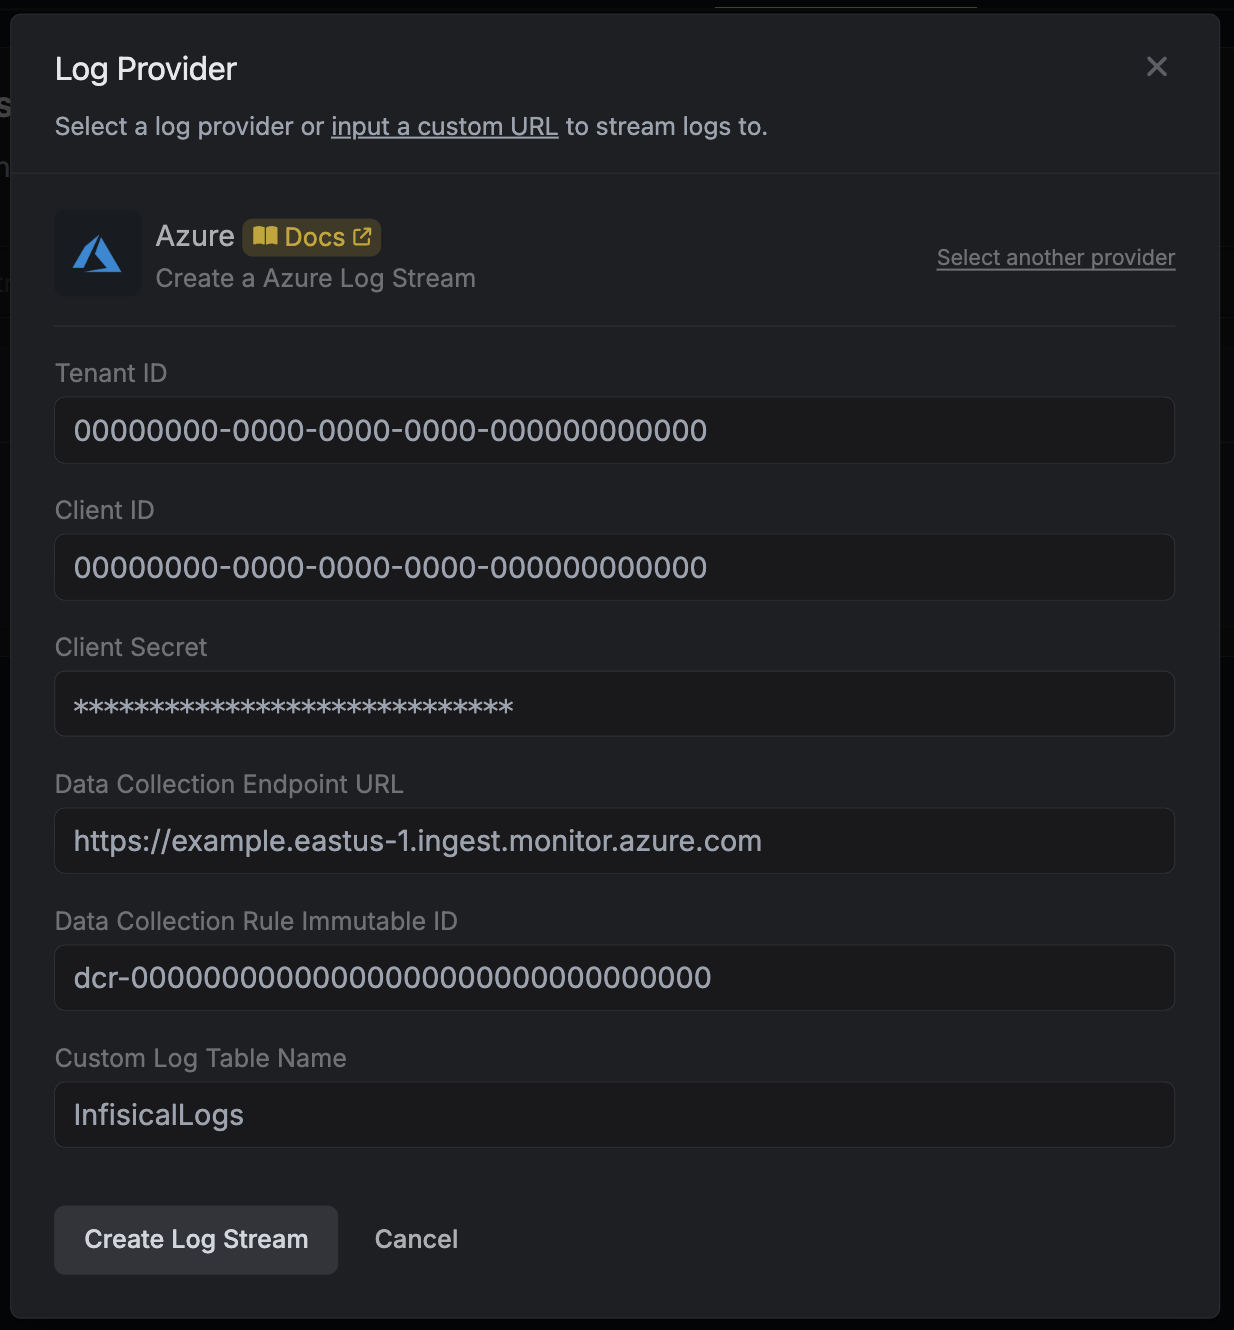
In Infisical, create a new audit log stream and select the Azure provider. Input the following details:
- Tenant ID: Your Tenant ID
- Client ID: The Client ID of an App Registration
- Client Secret: The Client Secret of an App Registration
- Data Collection Endpoint URL: Obtained from Step 1
- Data Collection Rule Immutable ID: Obtained from Step 4
-
Custom Log Table Name: Defined in Step 3
Better Stack
Better Stack
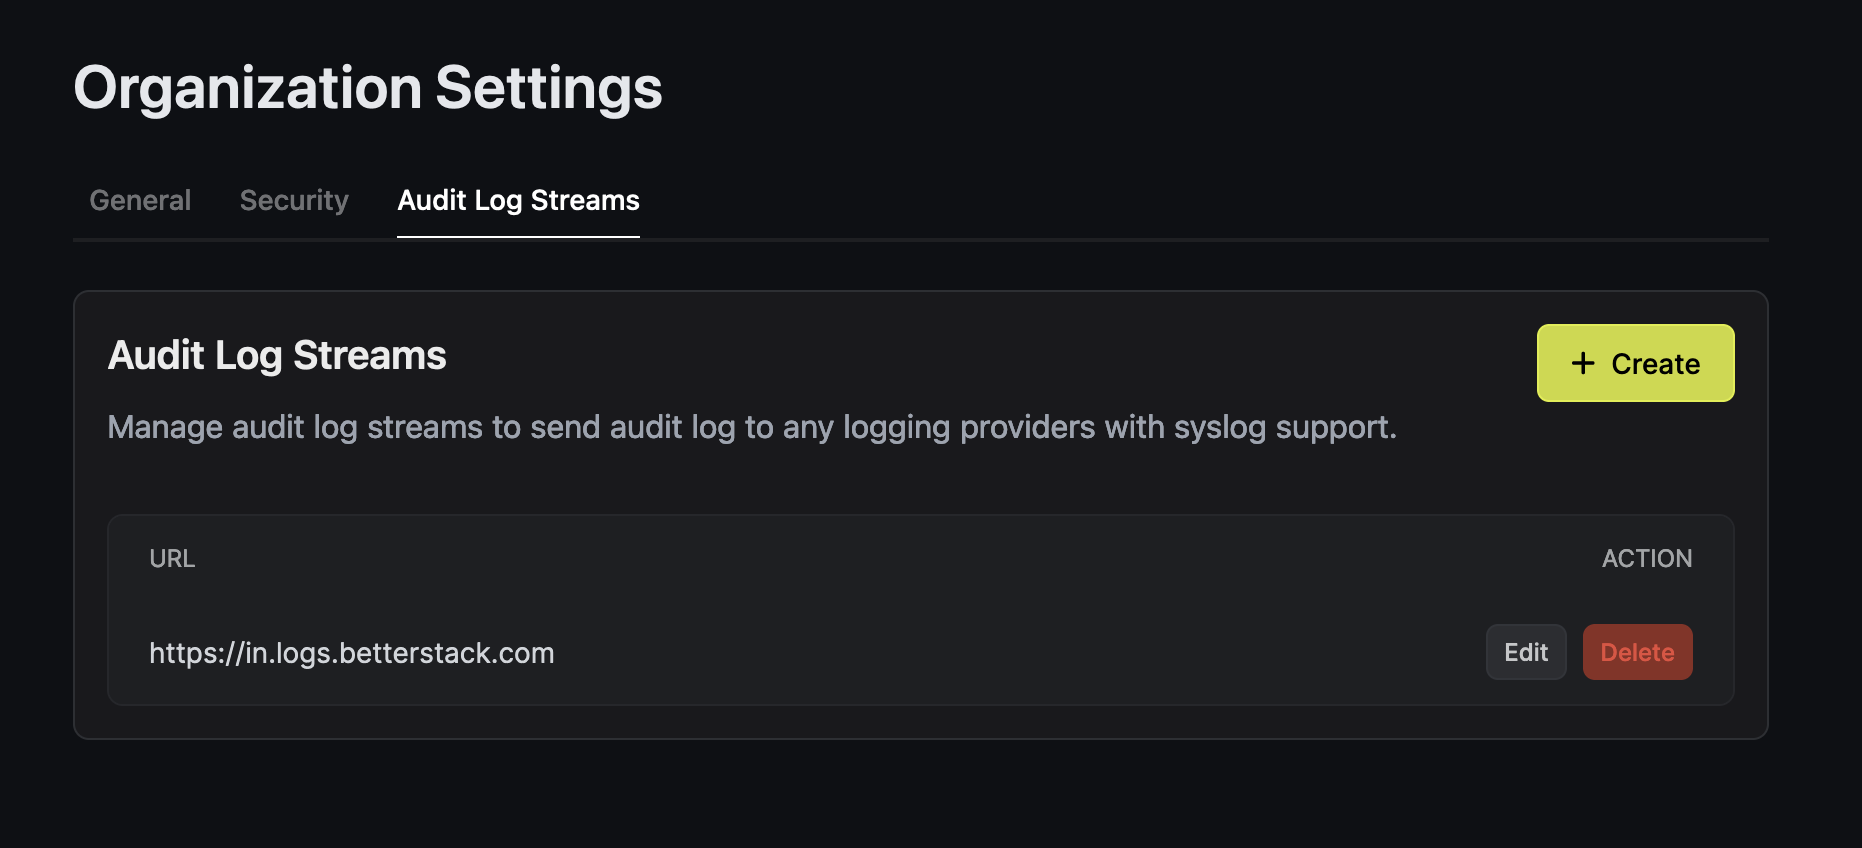
You can stream to Better Stack using a Custom log stream.
Connect Source
On Better Stack, select Connect Source and click Create source after providing a name.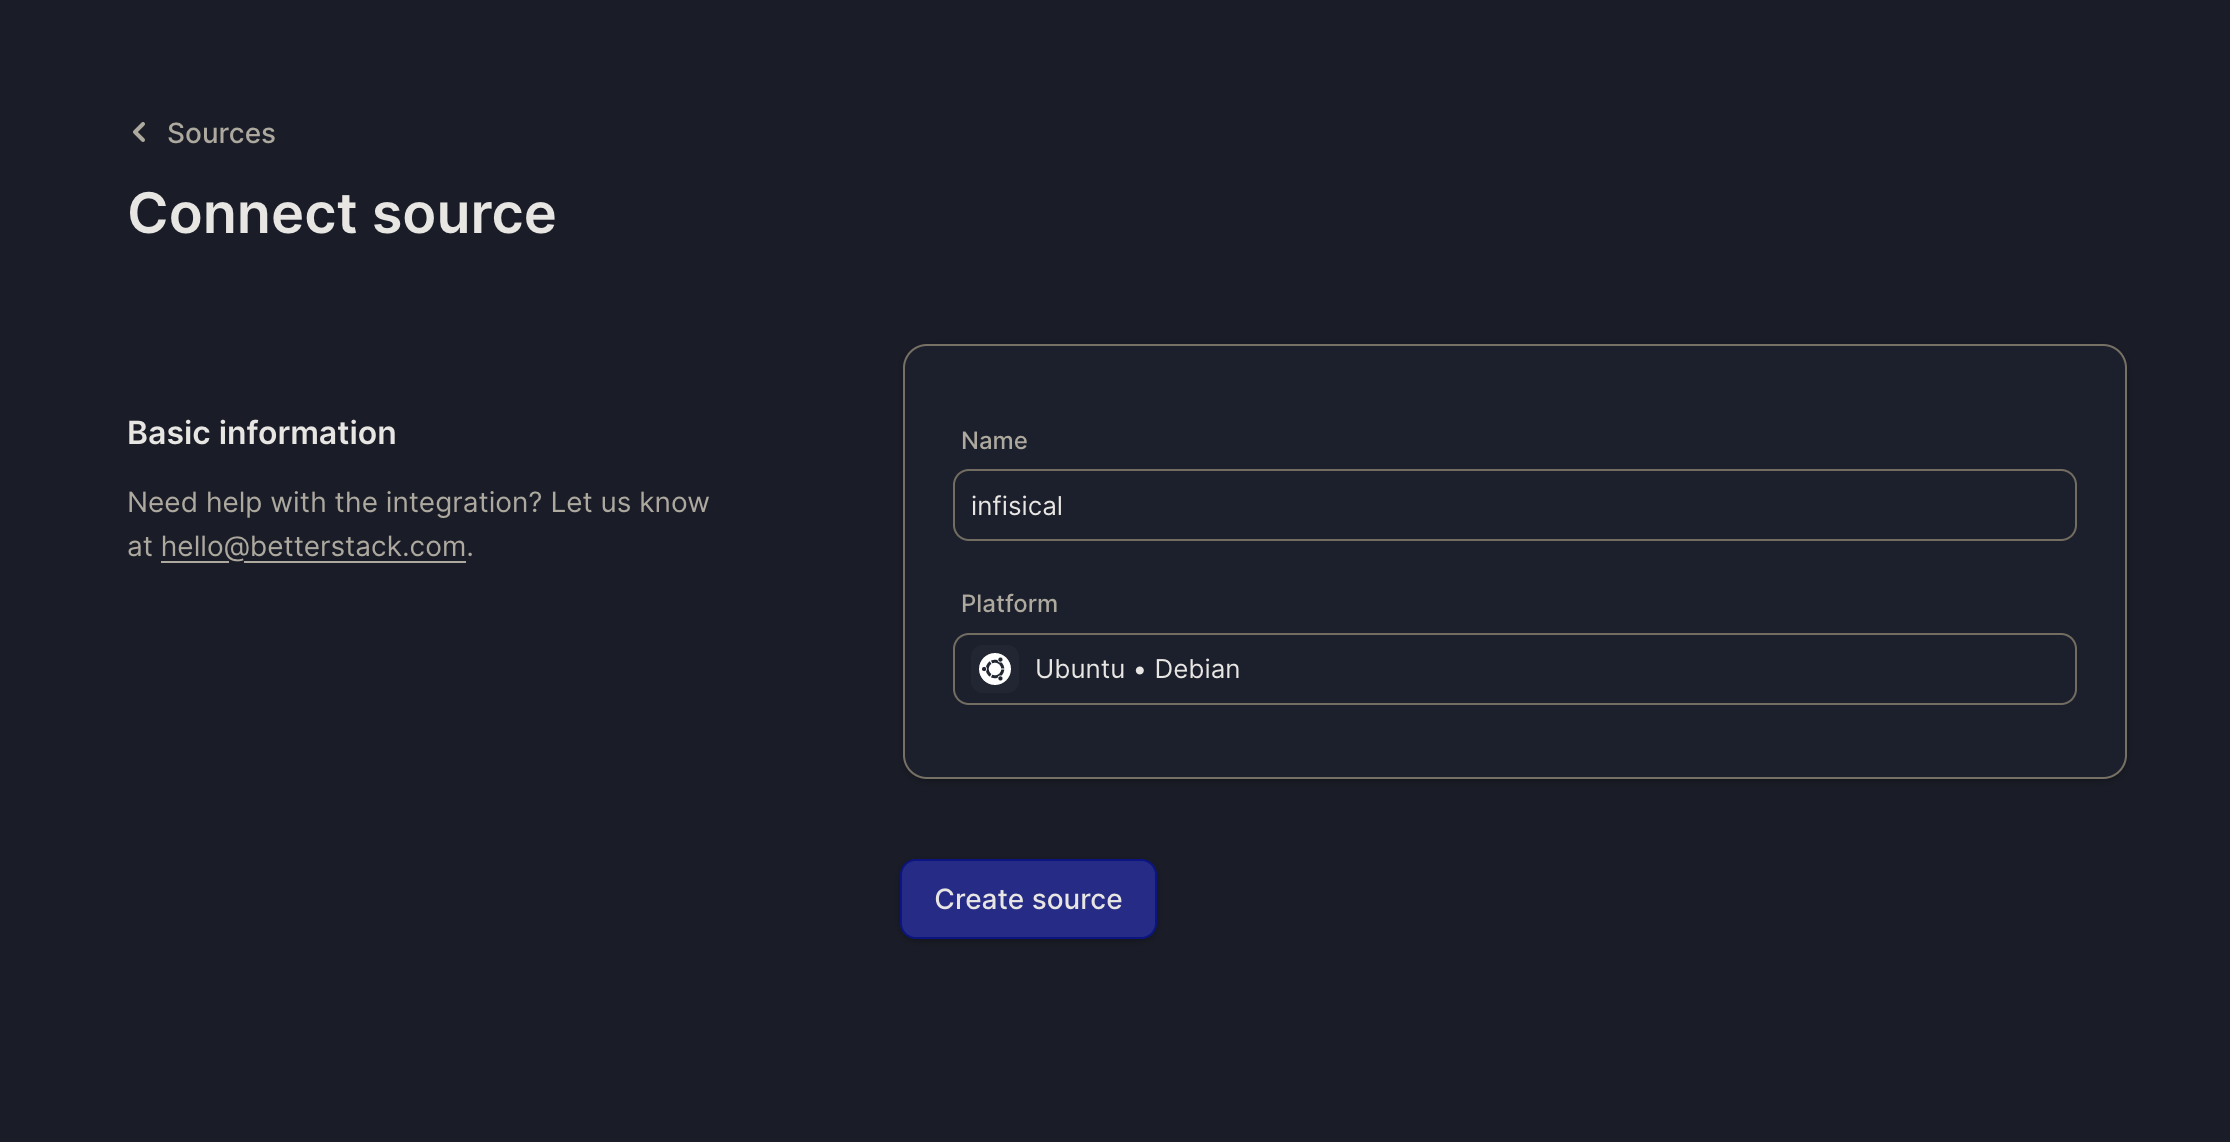 Once your source is created, take note of the endpoint and Source token for the next step.
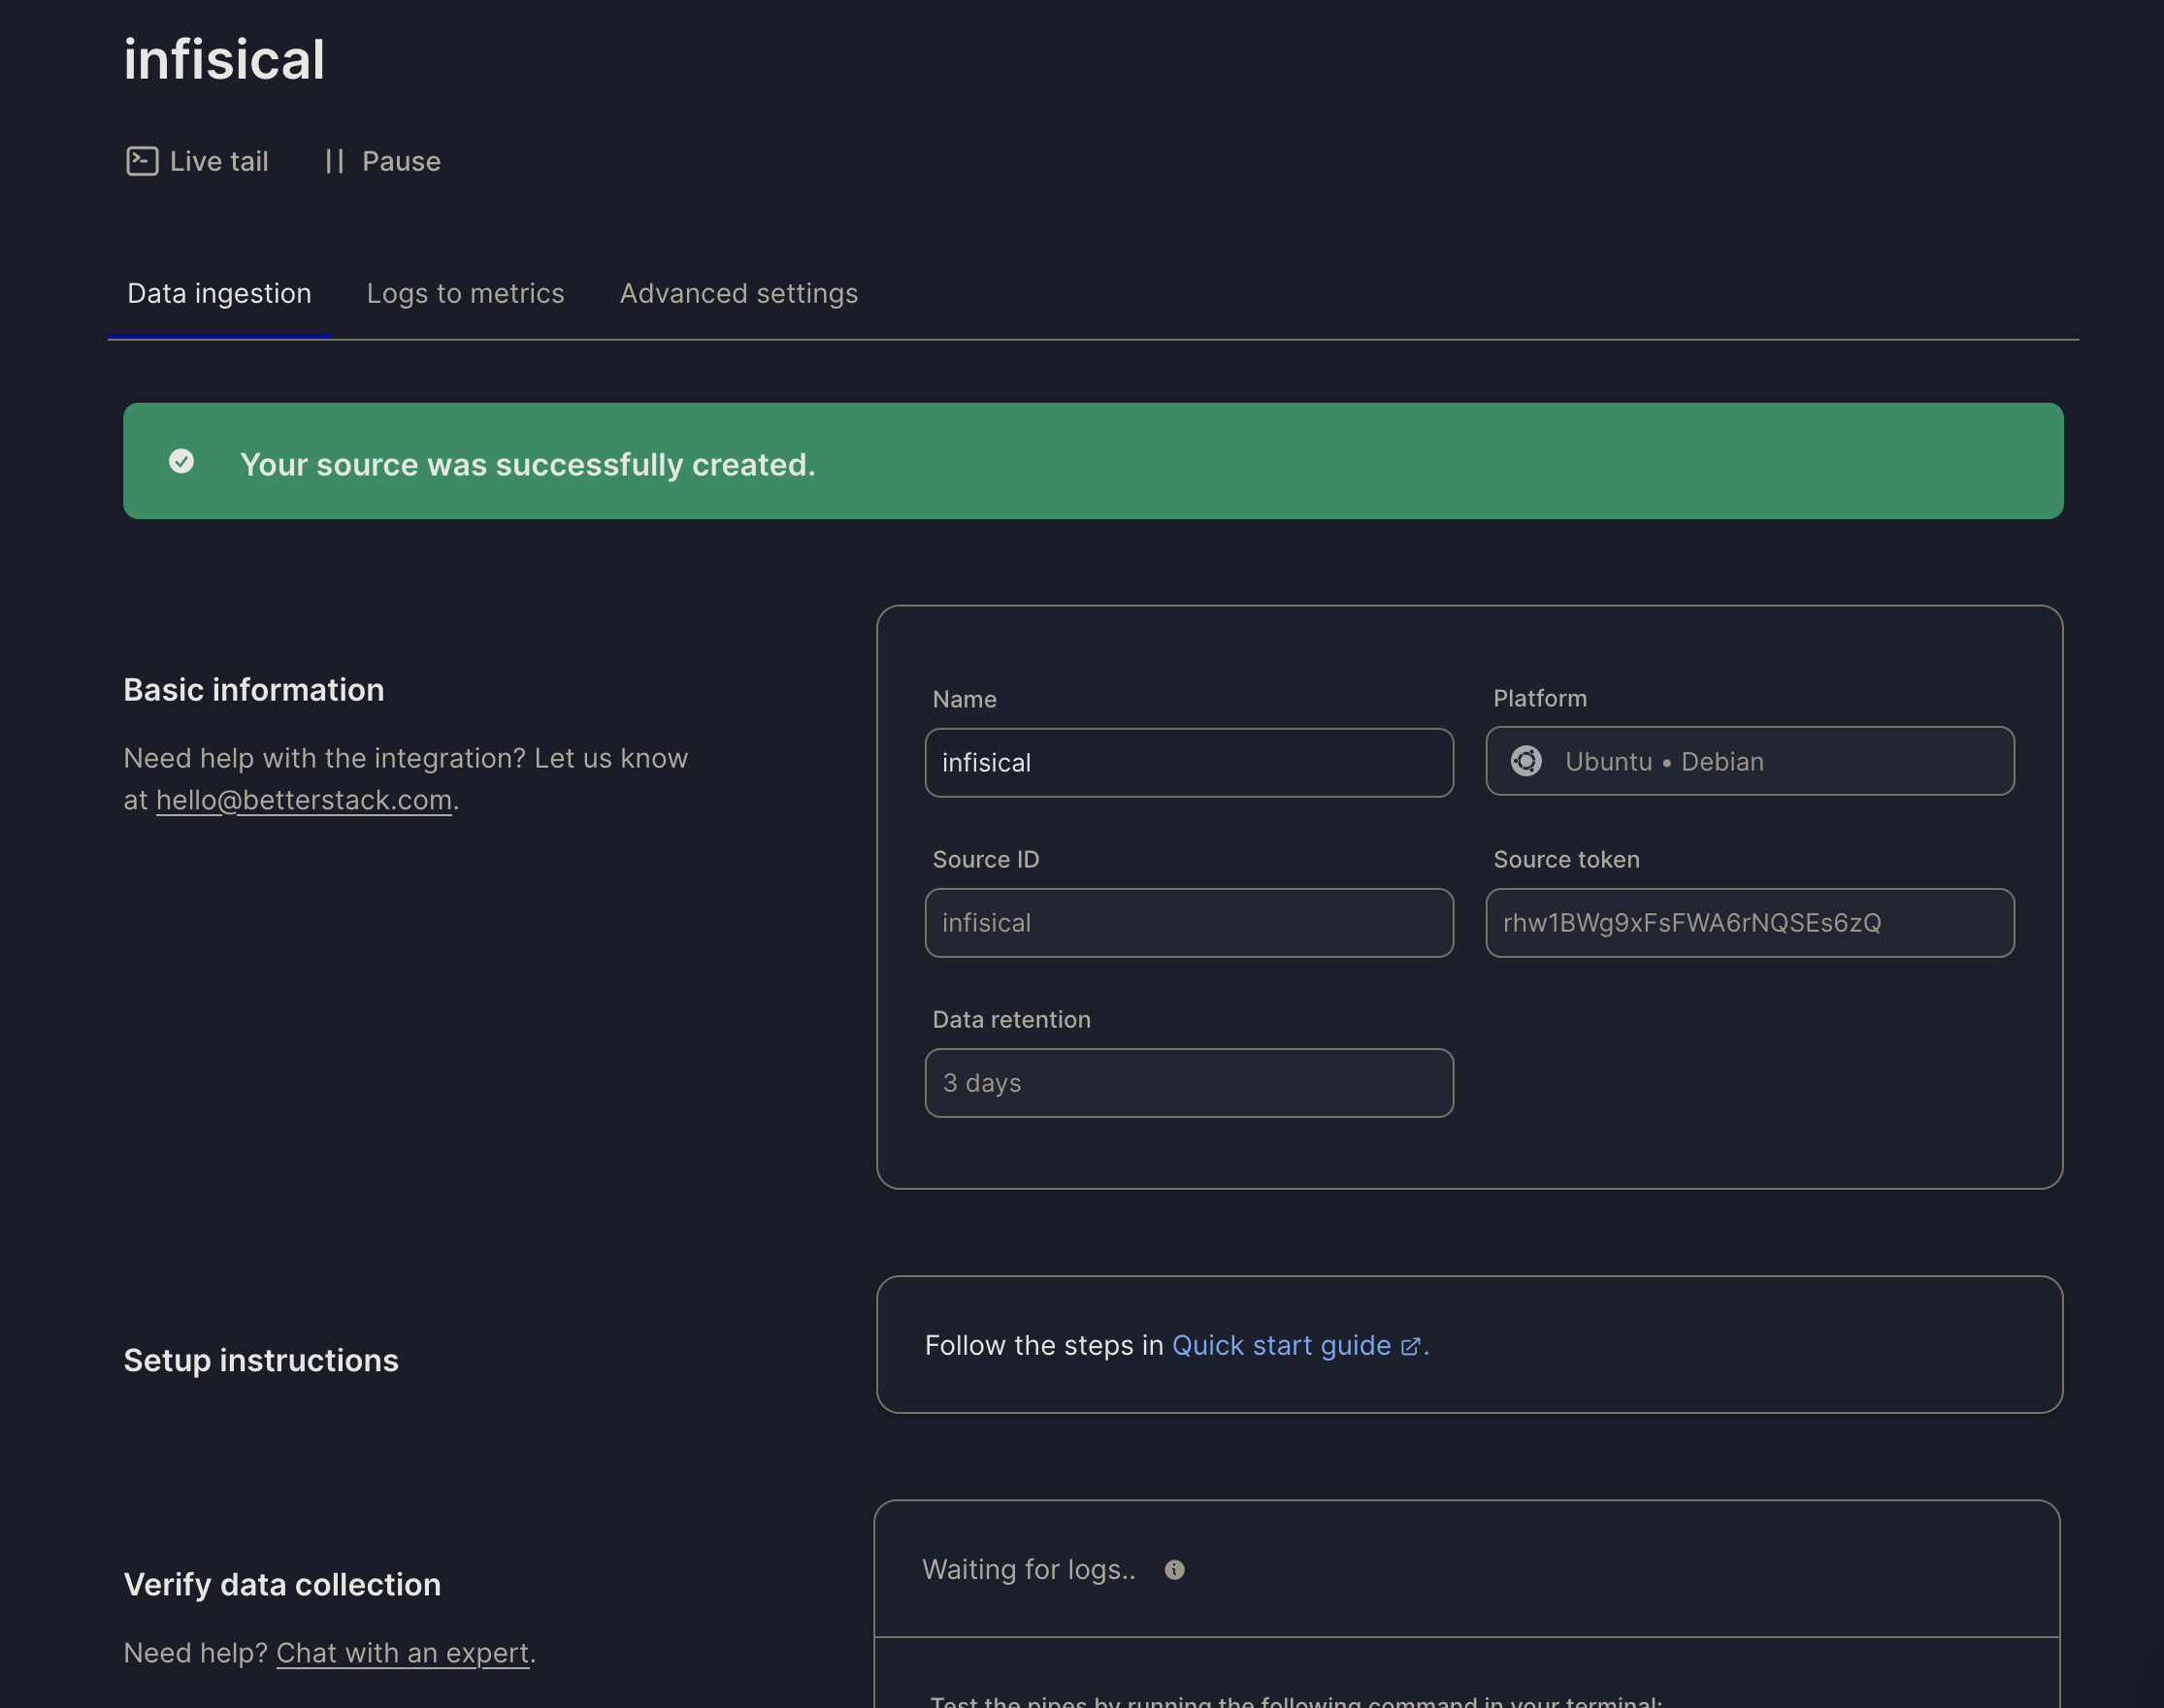
Once your source is created, take note of the endpoint and Source token for the next step.Create Audit Log Stream on Infisical
On Infisical, create a new audit log stream and select the Custom option.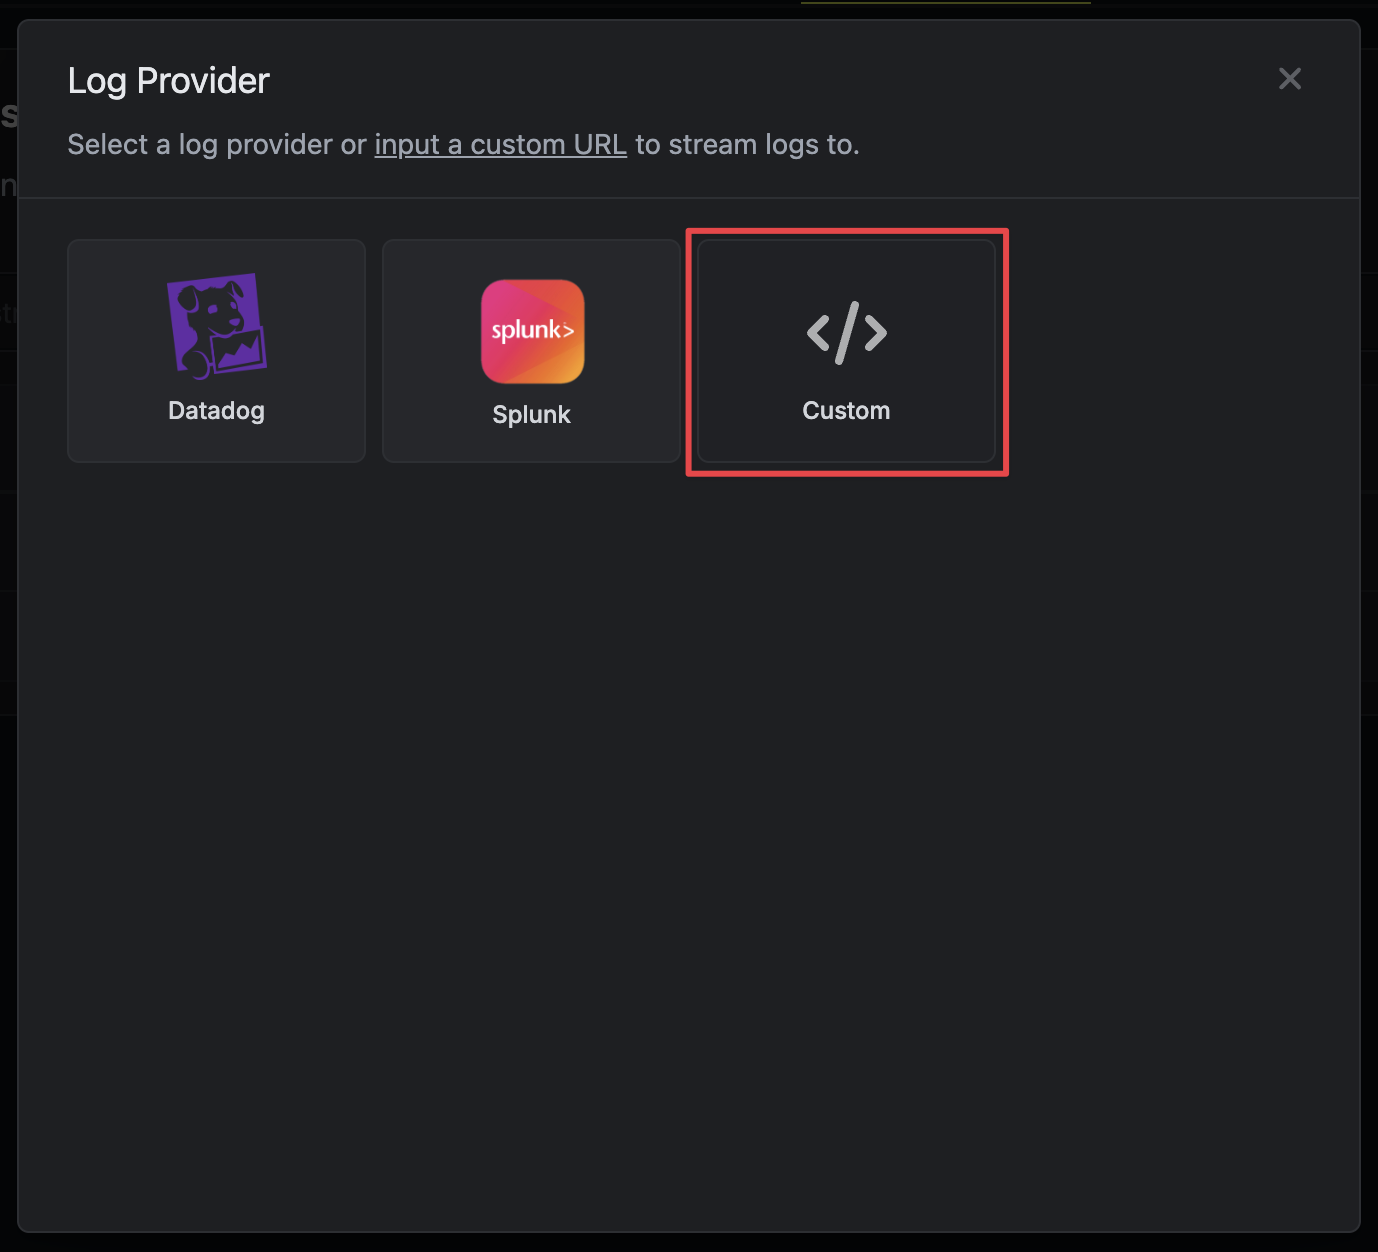
- Fill in the endpoint URL with your Better Stack source endpoint
-
Create a new header with key
Authorizationand set the value asBearer <betterstack-src-token>
Cribl
Cribl
Stream Infisical audit logs to Cribl Stream for centralized processing and routing. Infisical supports Cribl as a provider for seamless integration.
Create Infisical Data Source
In Cribl Stream, navigate to Worker Groups and select your Worker Group. Take note of the Ingress Address for later steps.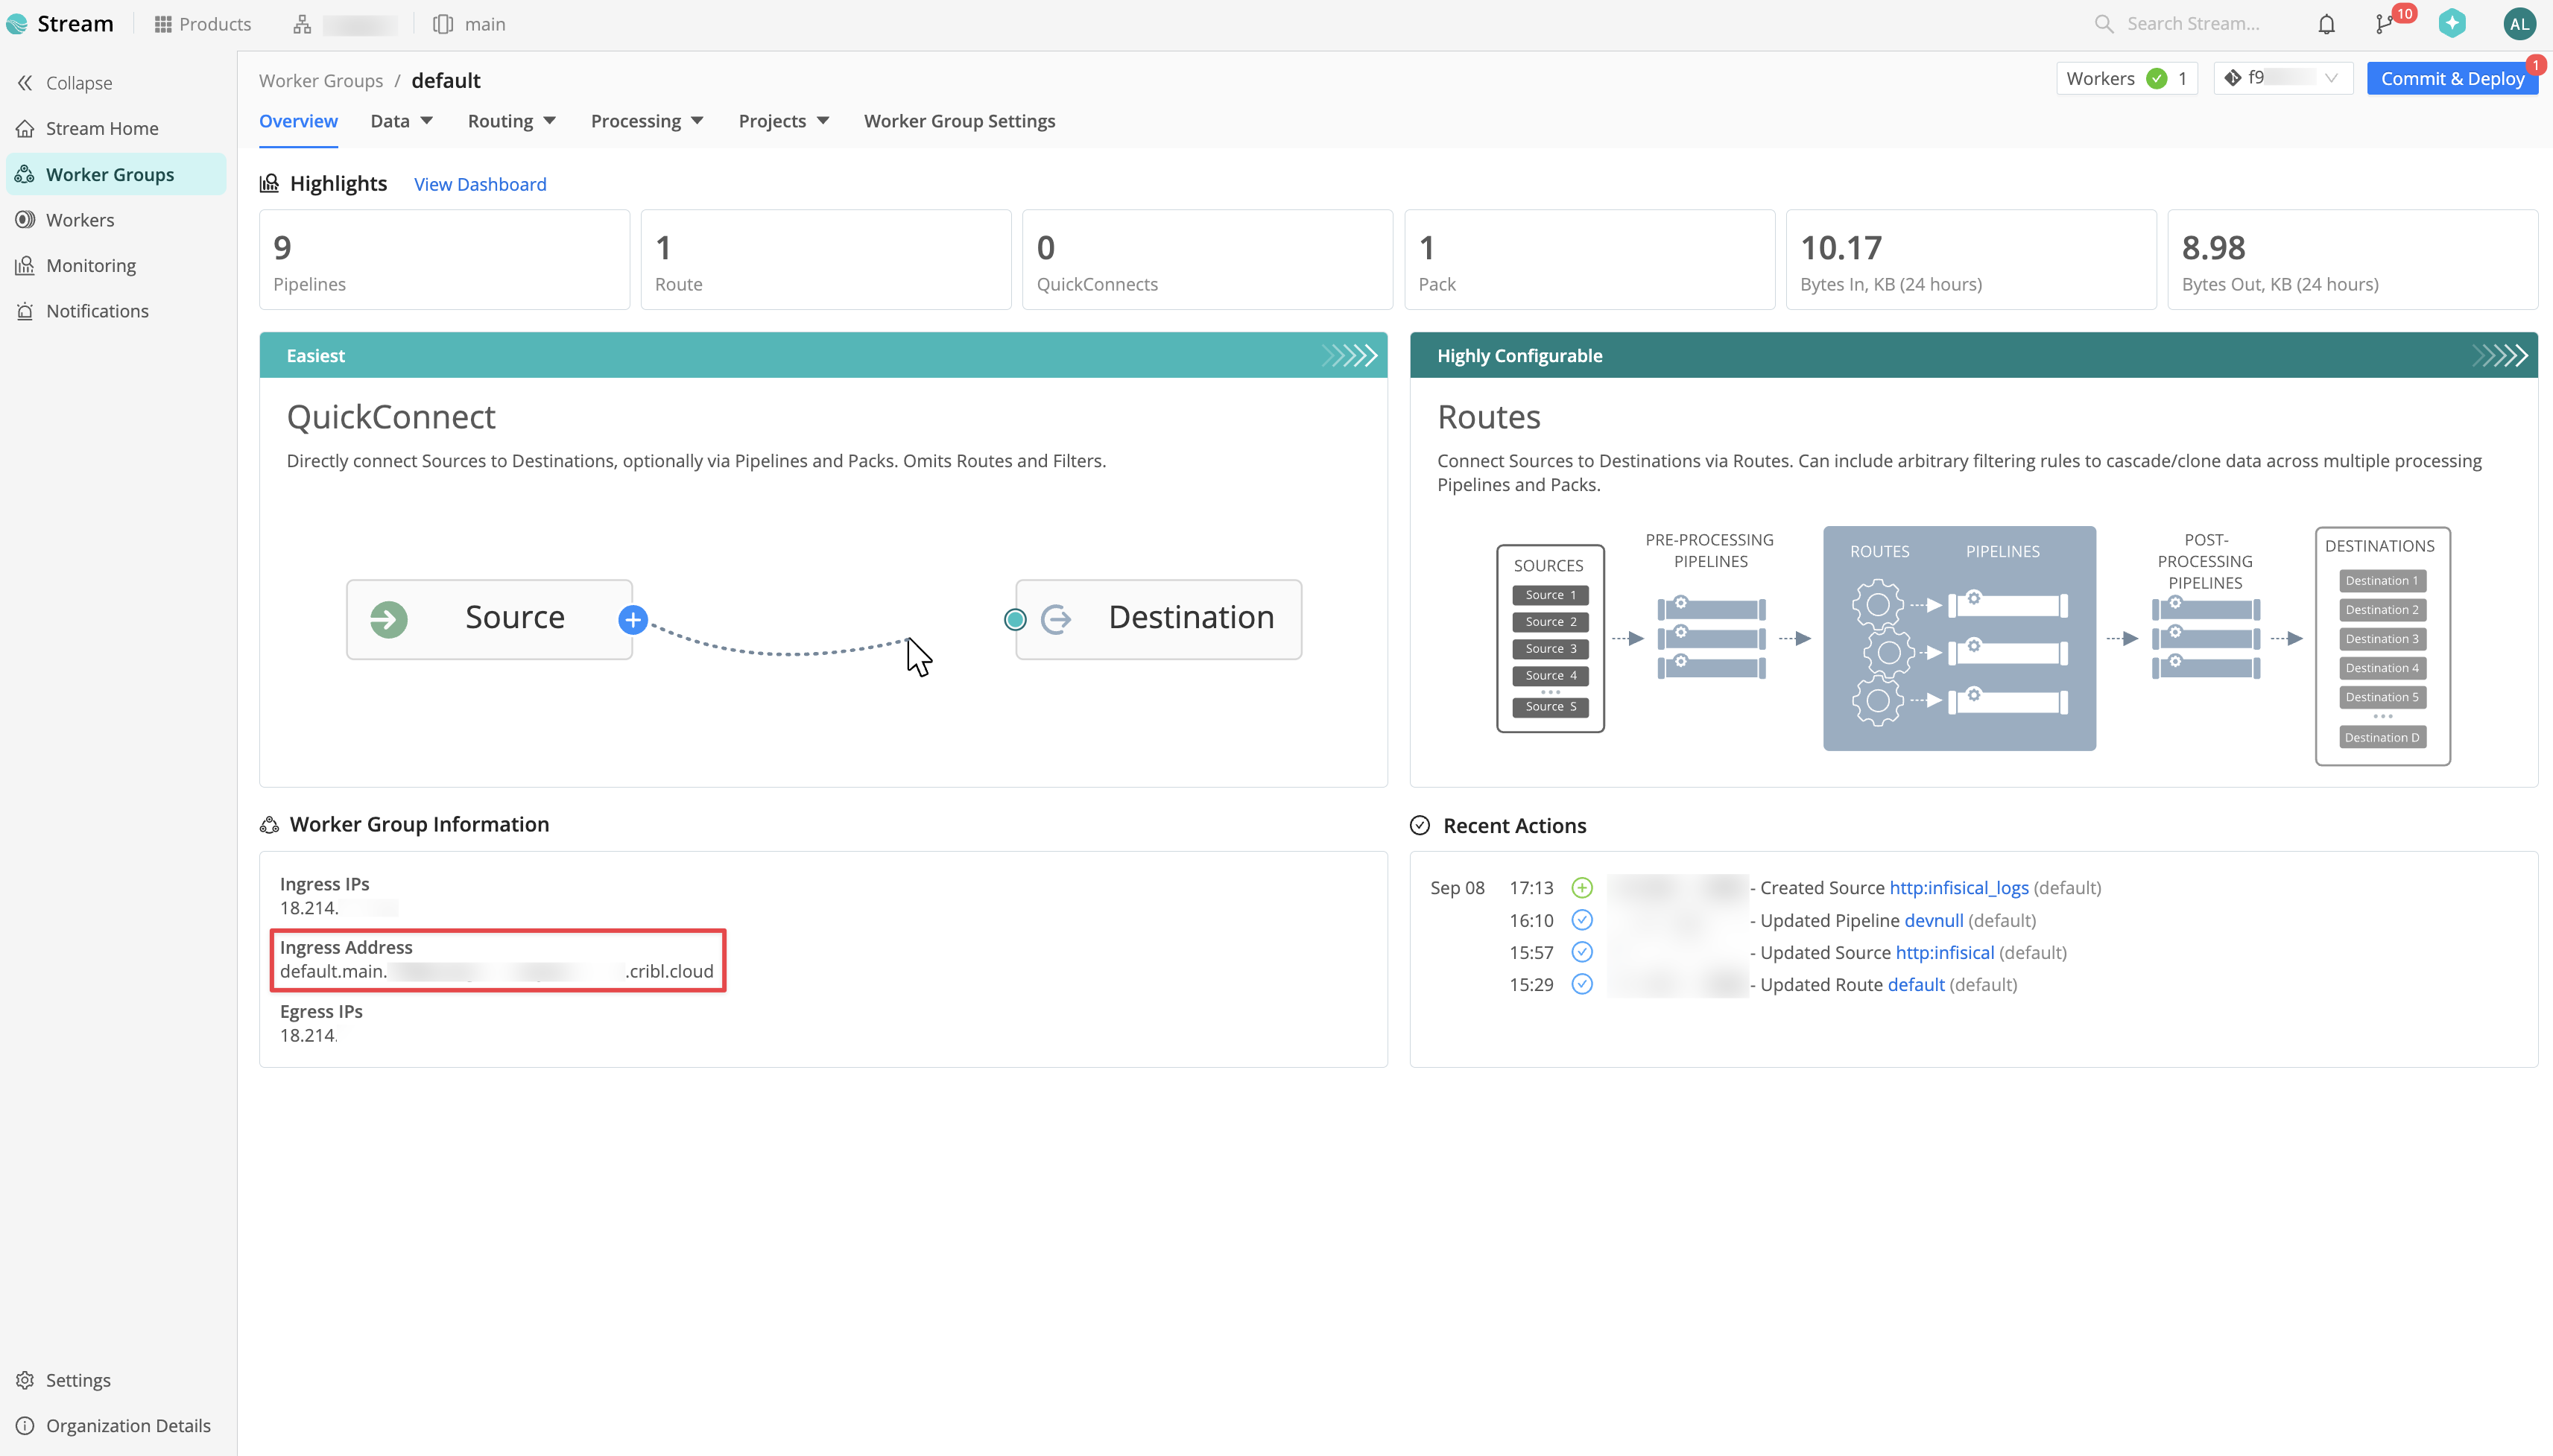 Within your Worker Group, navigate to Data > Sources > HTTP and click Add Source.
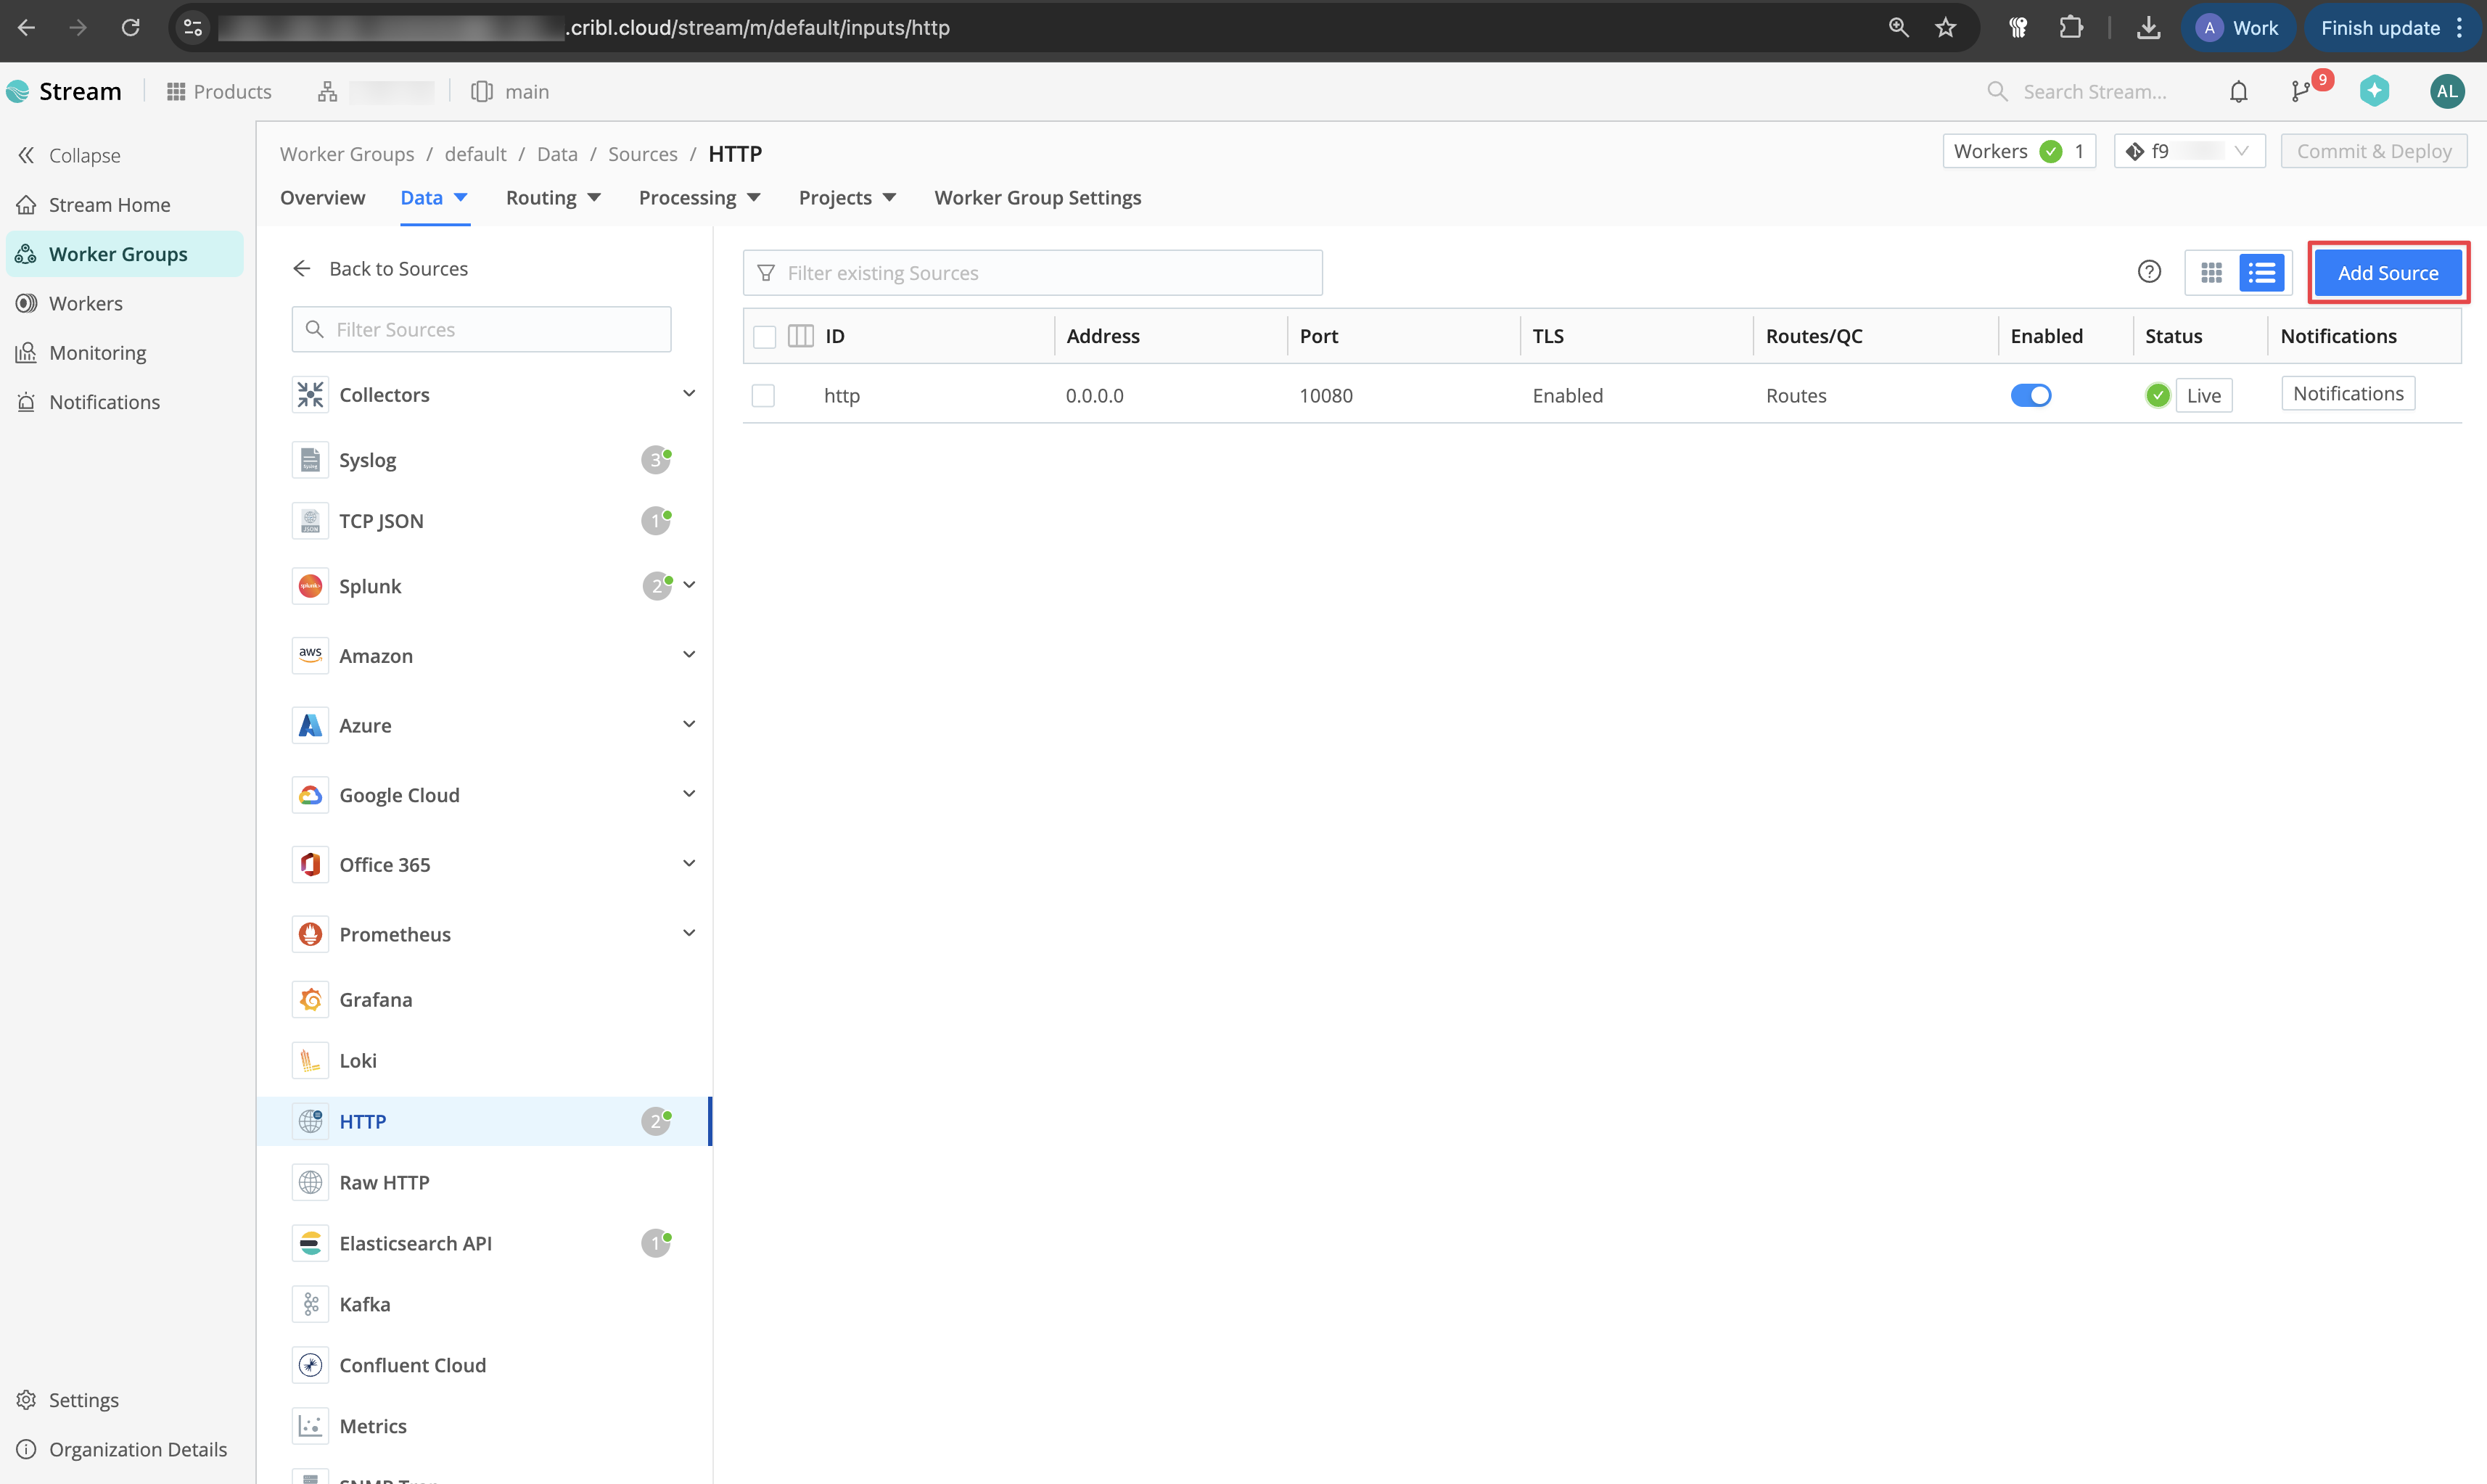 Configure the Input ID, Port, and Cribl HTTP event API path (e.g.,
 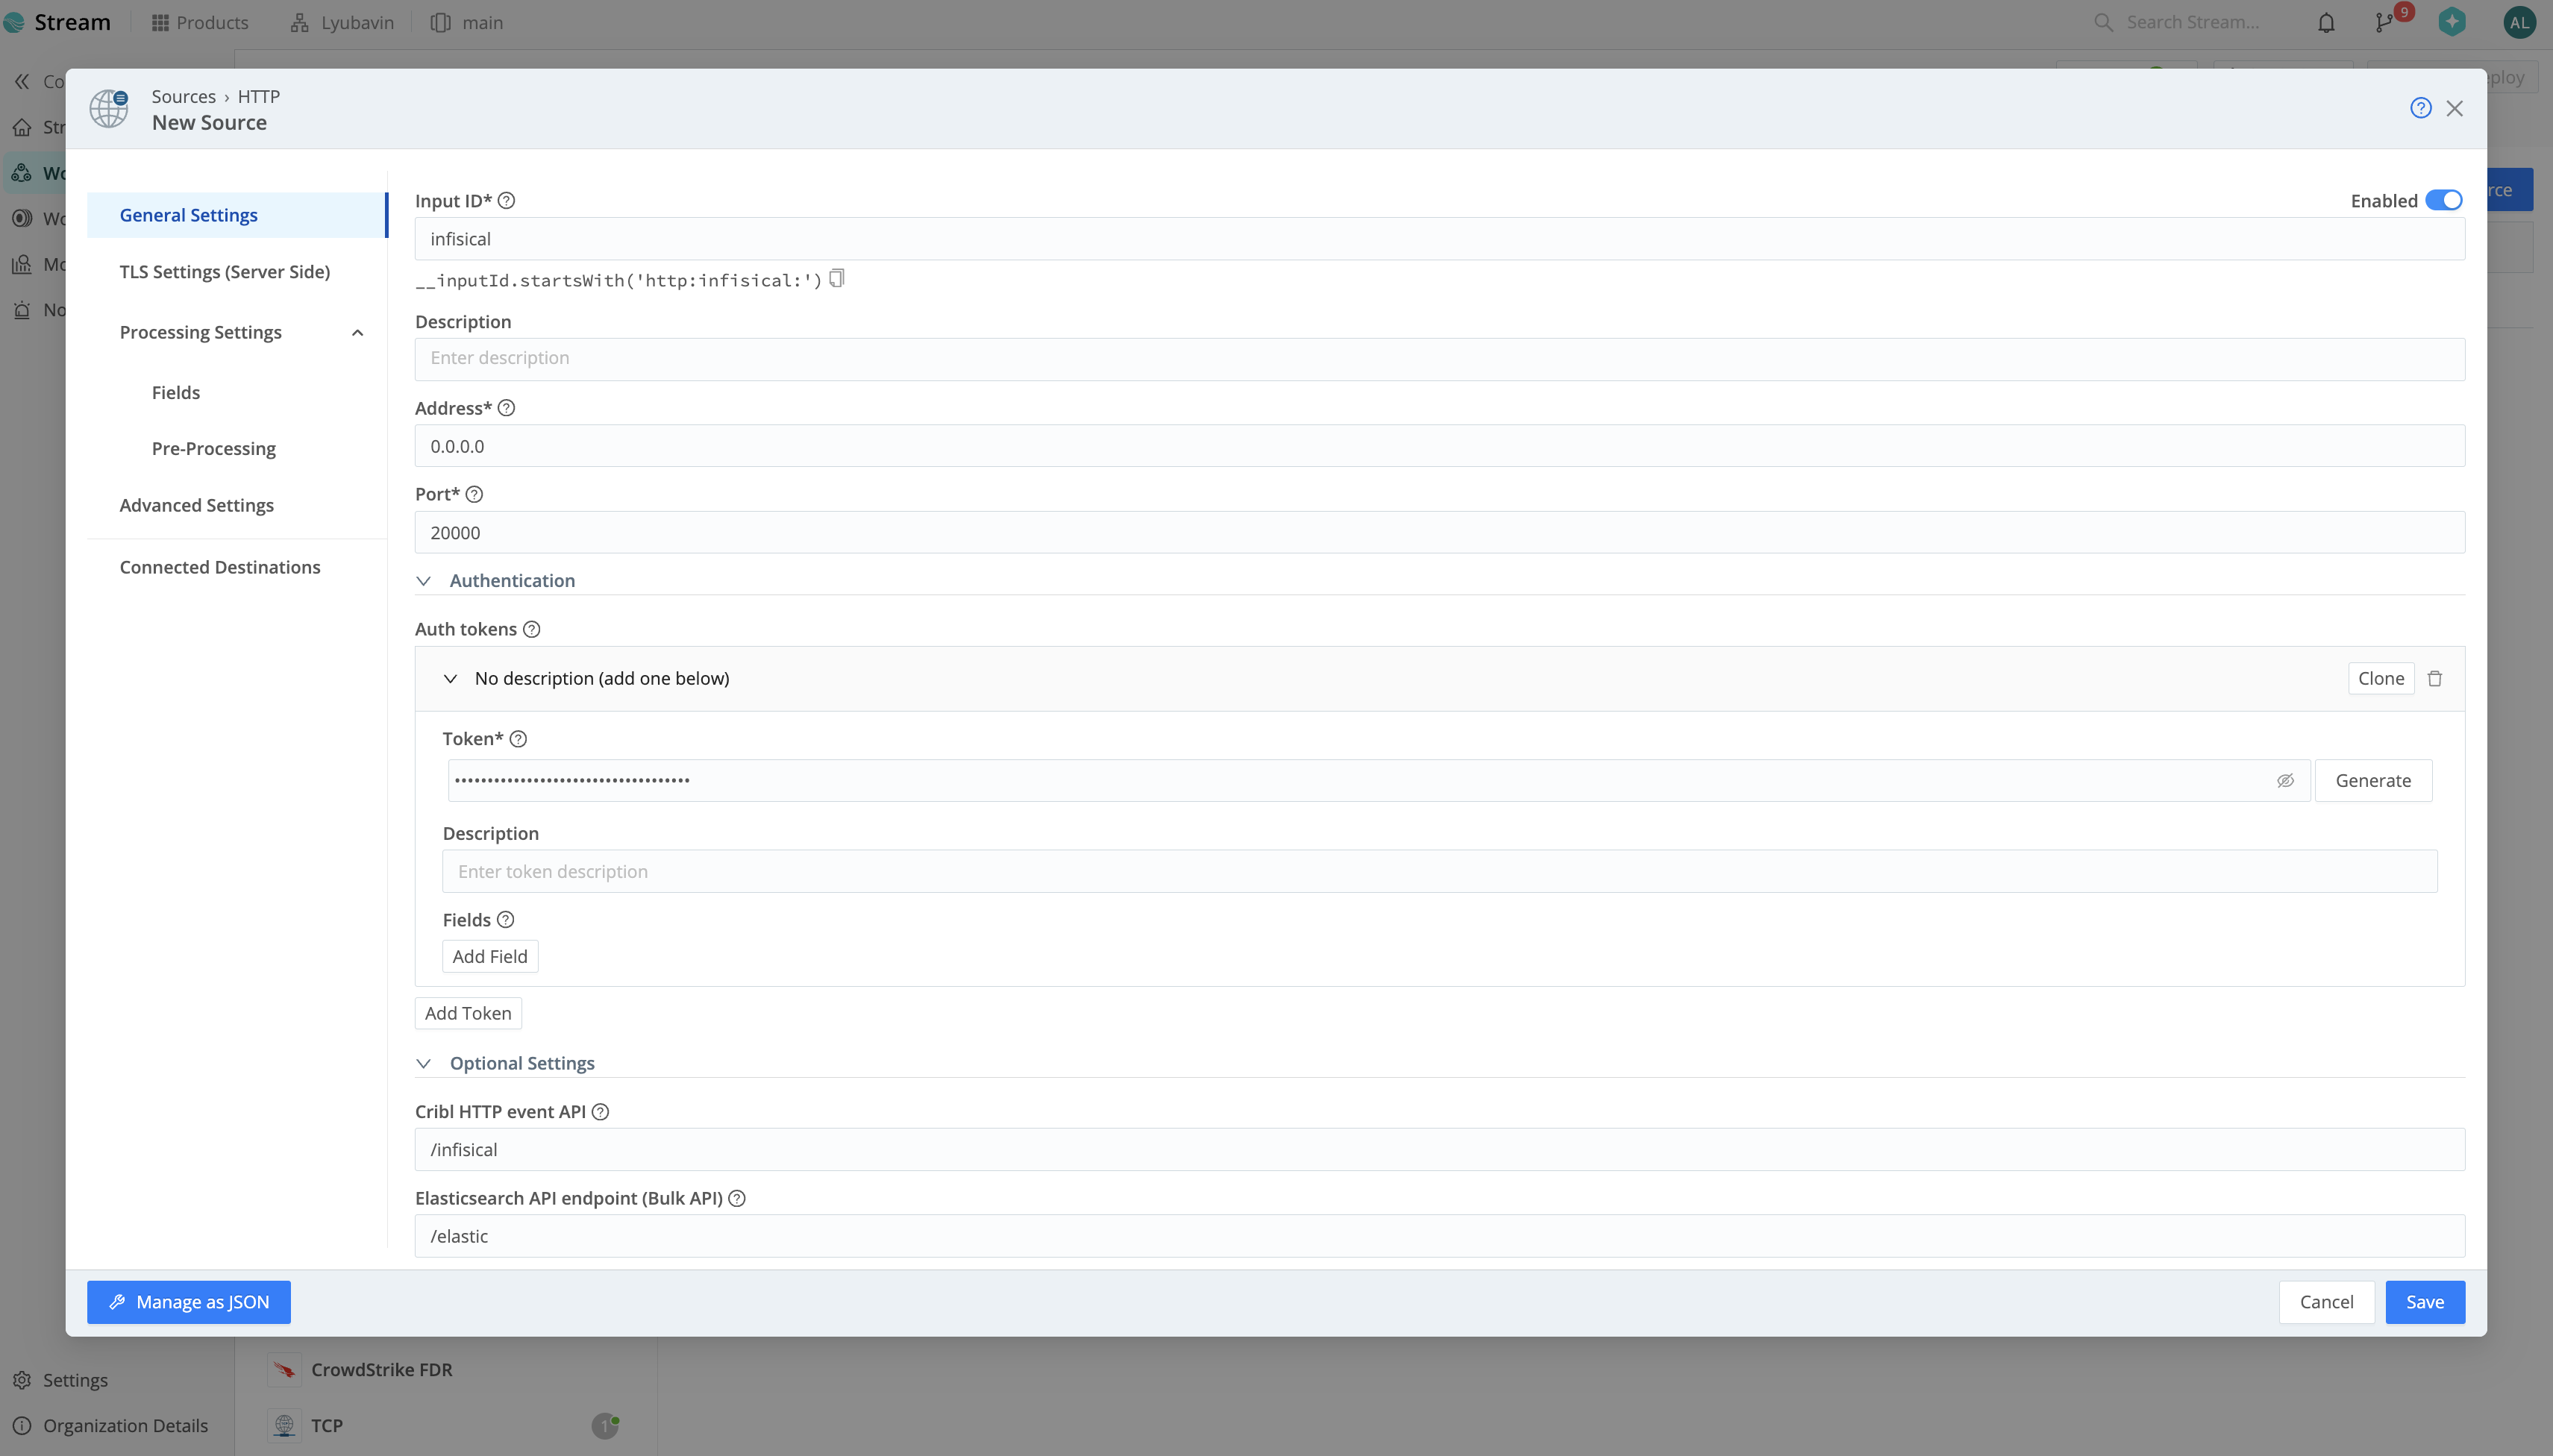 Once you’ve configured the Data Source, click Save and deploy your changes.
Within your Worker Group, navigate to Data > Sources > HTTP and click Add Source.Configure the Input ID, Port, and Cribl HTTP event API path (e.g., /infisical). Then, generate an Auth Token.You can optionally configure TLS in the TLS Settings tab and add a pipeline in the Pre-Processing tab.Once you’ve configured the Data Source, click Save and deploy your changes.Create Audit Log Stream on Infisical
On Infisical, create a new audit log stream and select the Cribl provider option.Input the following credentials: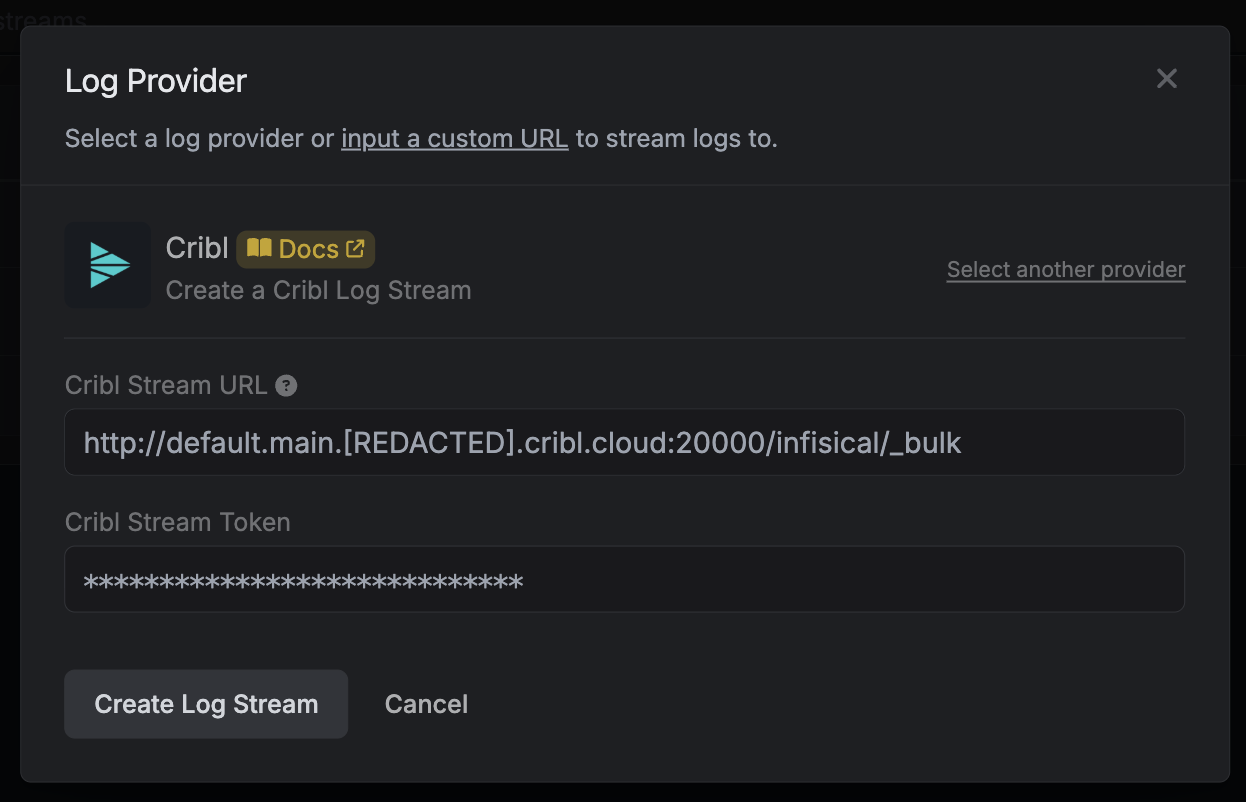 Once you’re finished, click Create Log Stream.
- Cribl Stream URL: Your HTTP source endpoint composed of
http://<ingress-address>:<port>/<http-event-api-path>/_bulk - Cribl Stream Token: The authentication token from Step 1
If you configured TLS for your Data Source, use the
https:// protocol.Once you’re finished, click Create Log Stream.Datadog
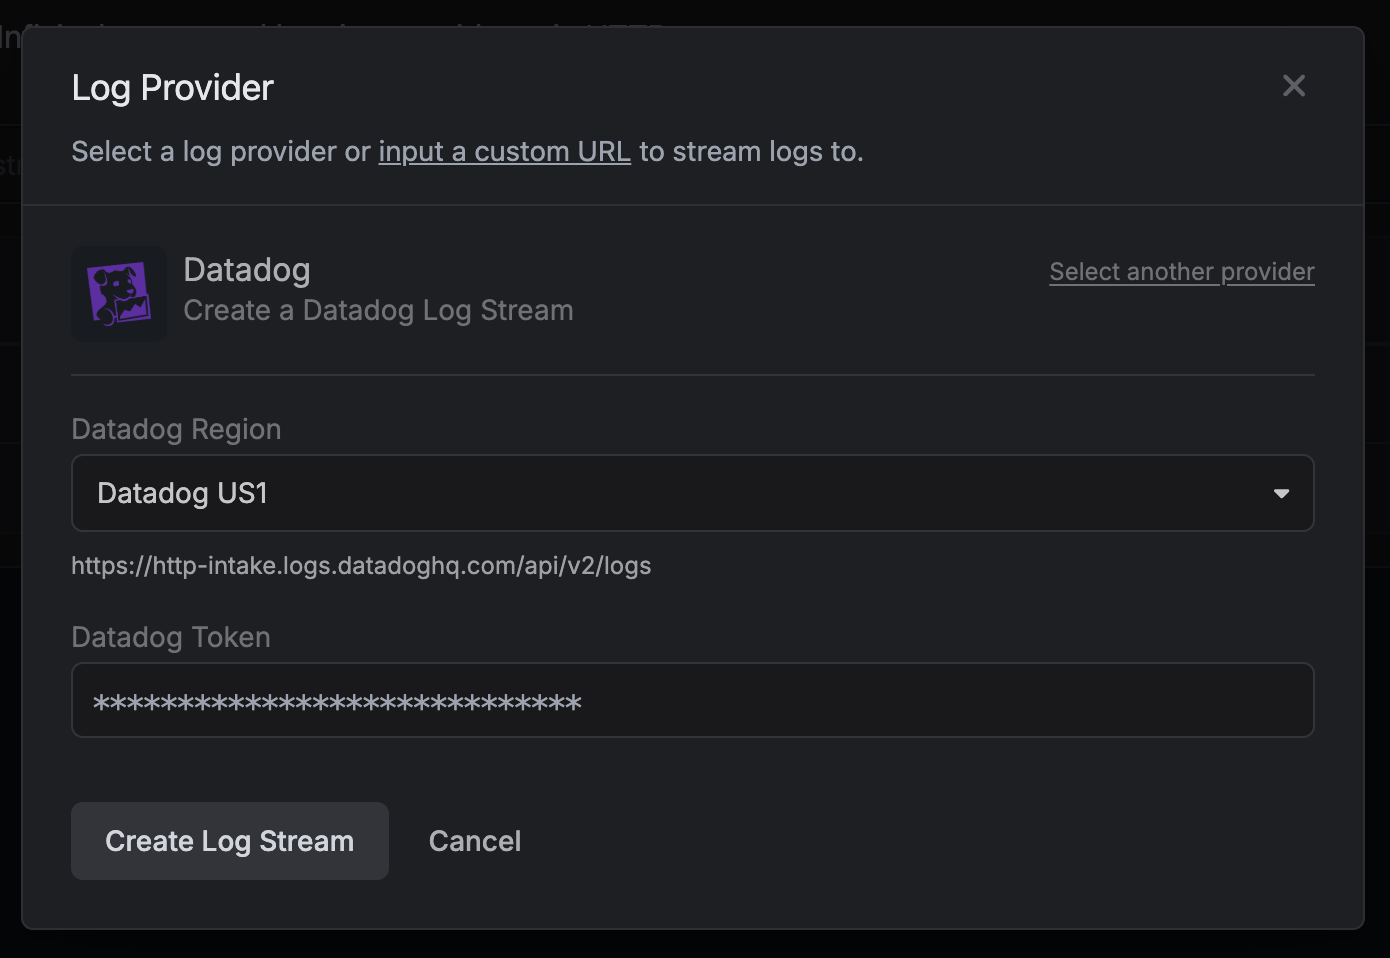
Datadog
You can stream to Datadog using the Datadog provider log stream.
Splunk
Splunk
You can stream to Splunk using the Splunk provider log stream.
Obtain Splunk Token
Navigate to Settings > Data Inputs.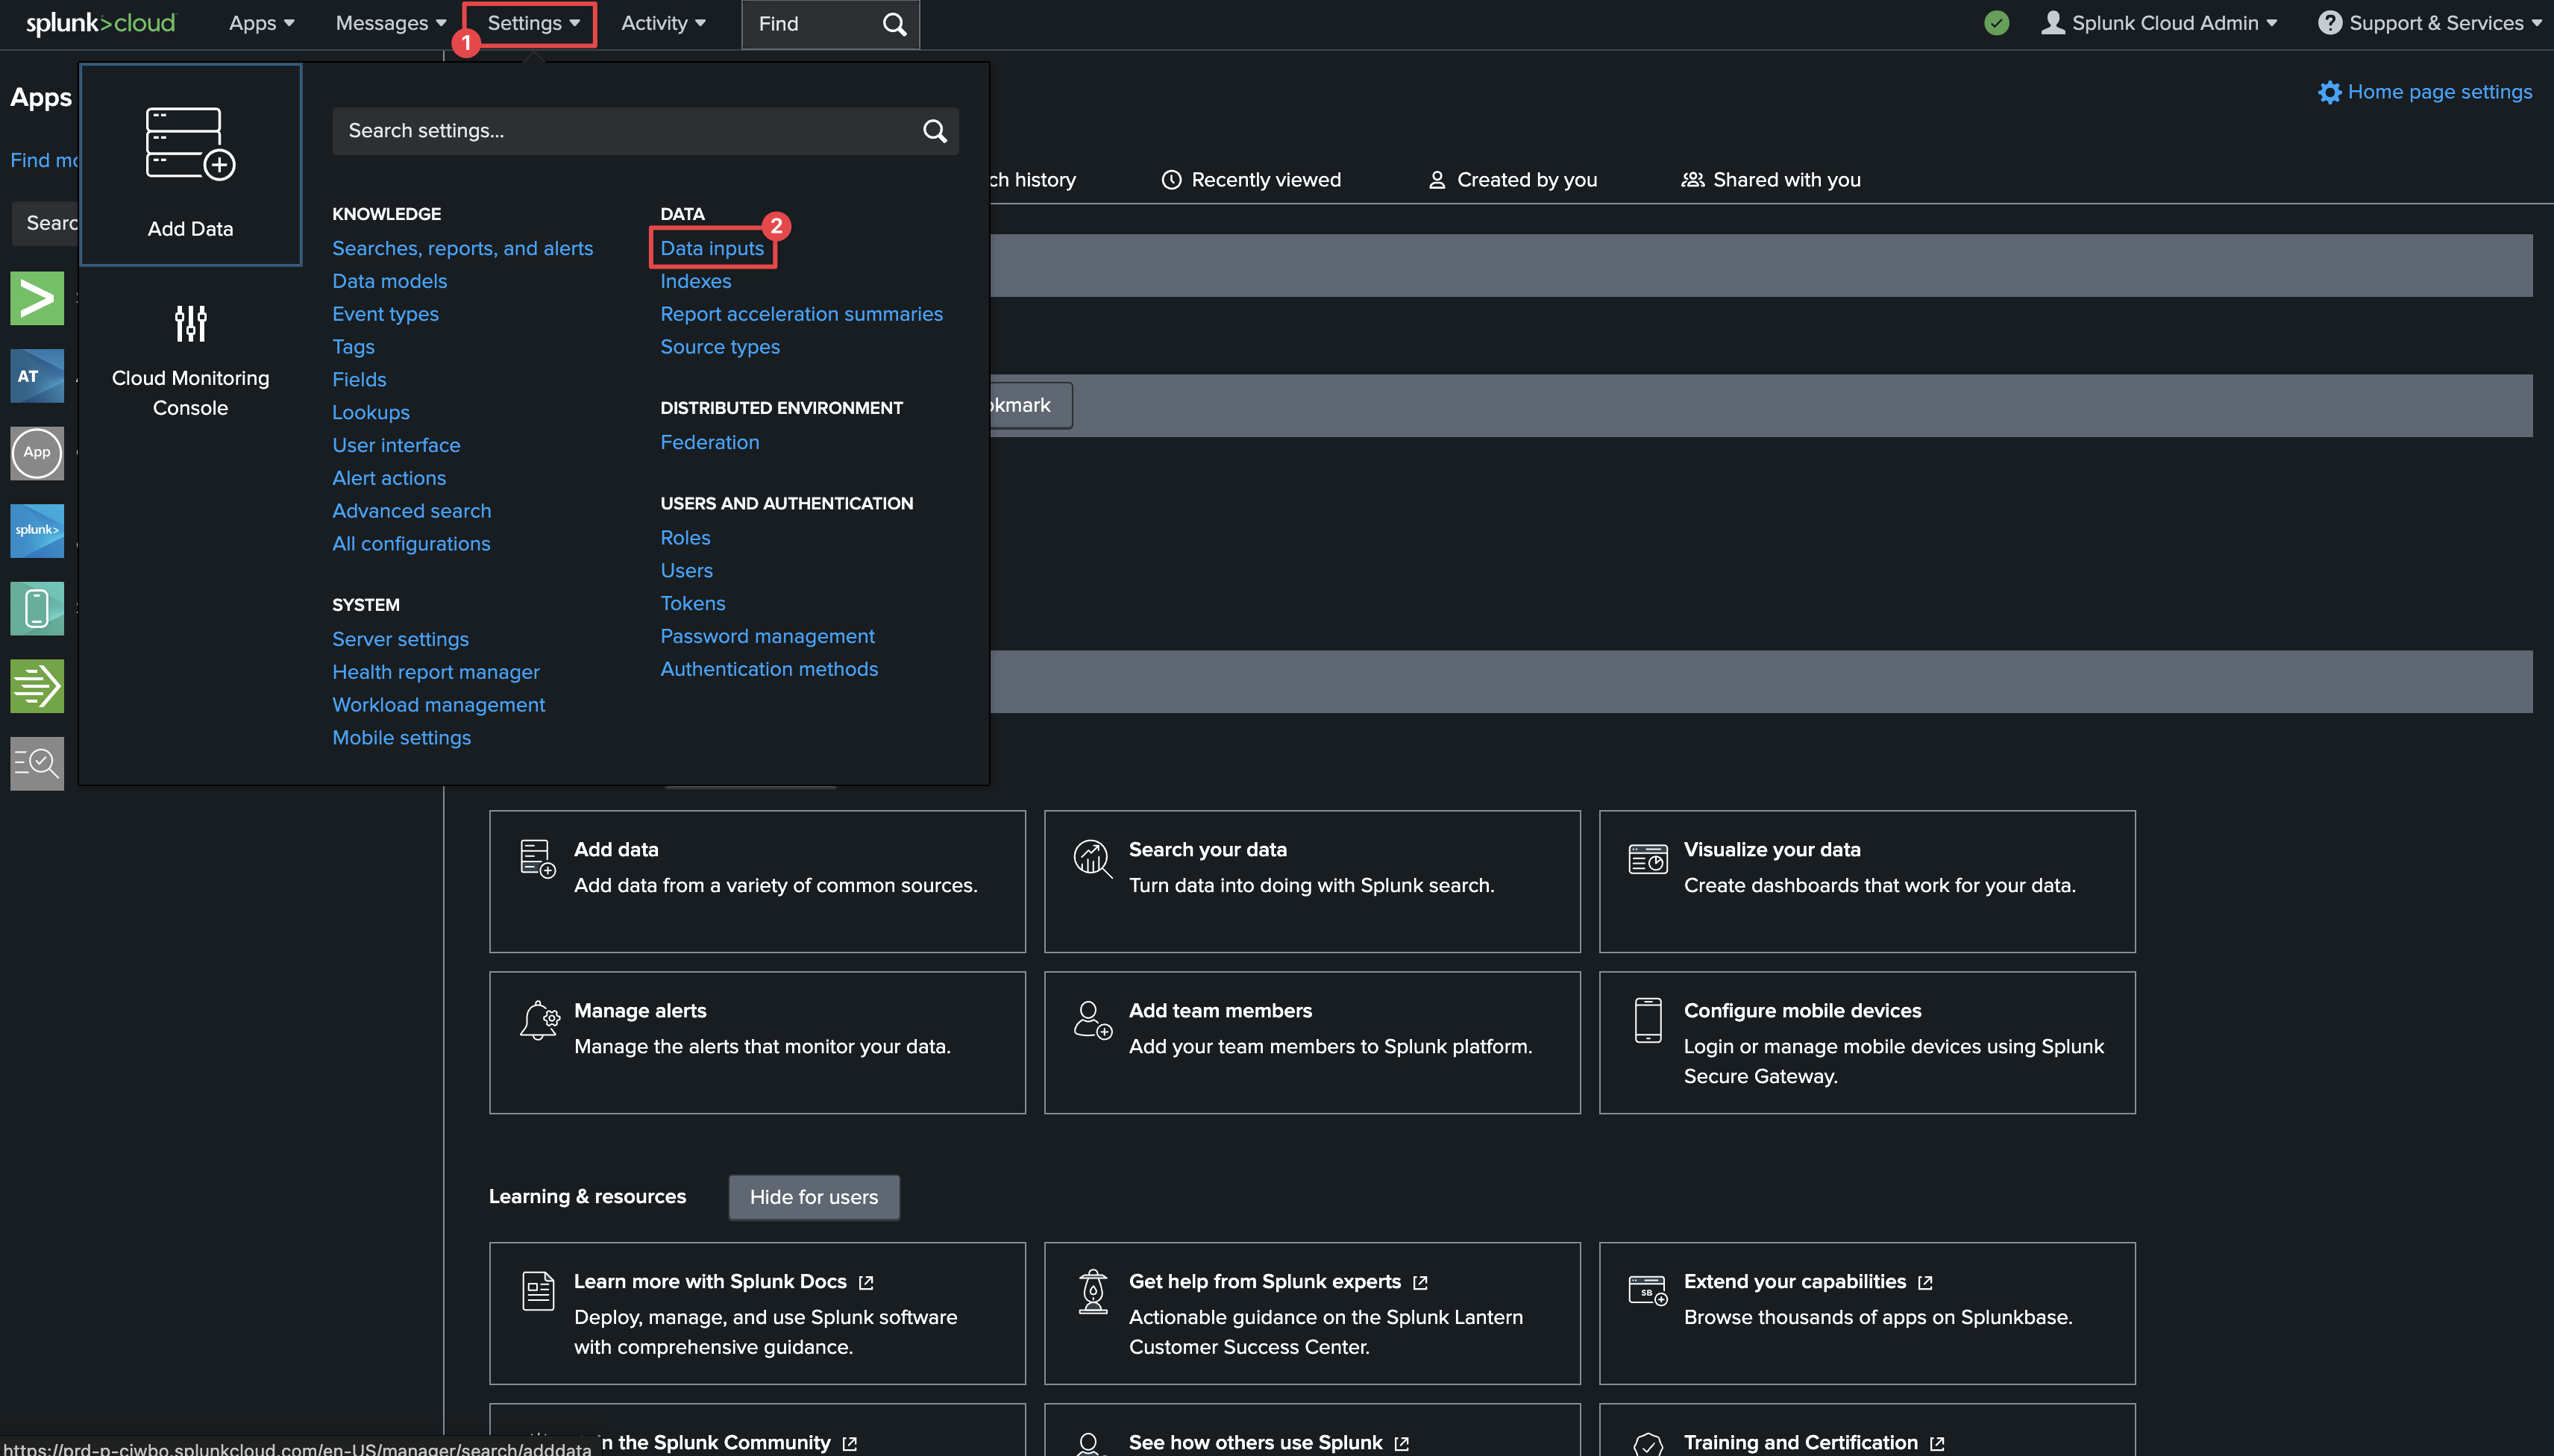 Click on HTTP Event Collector.
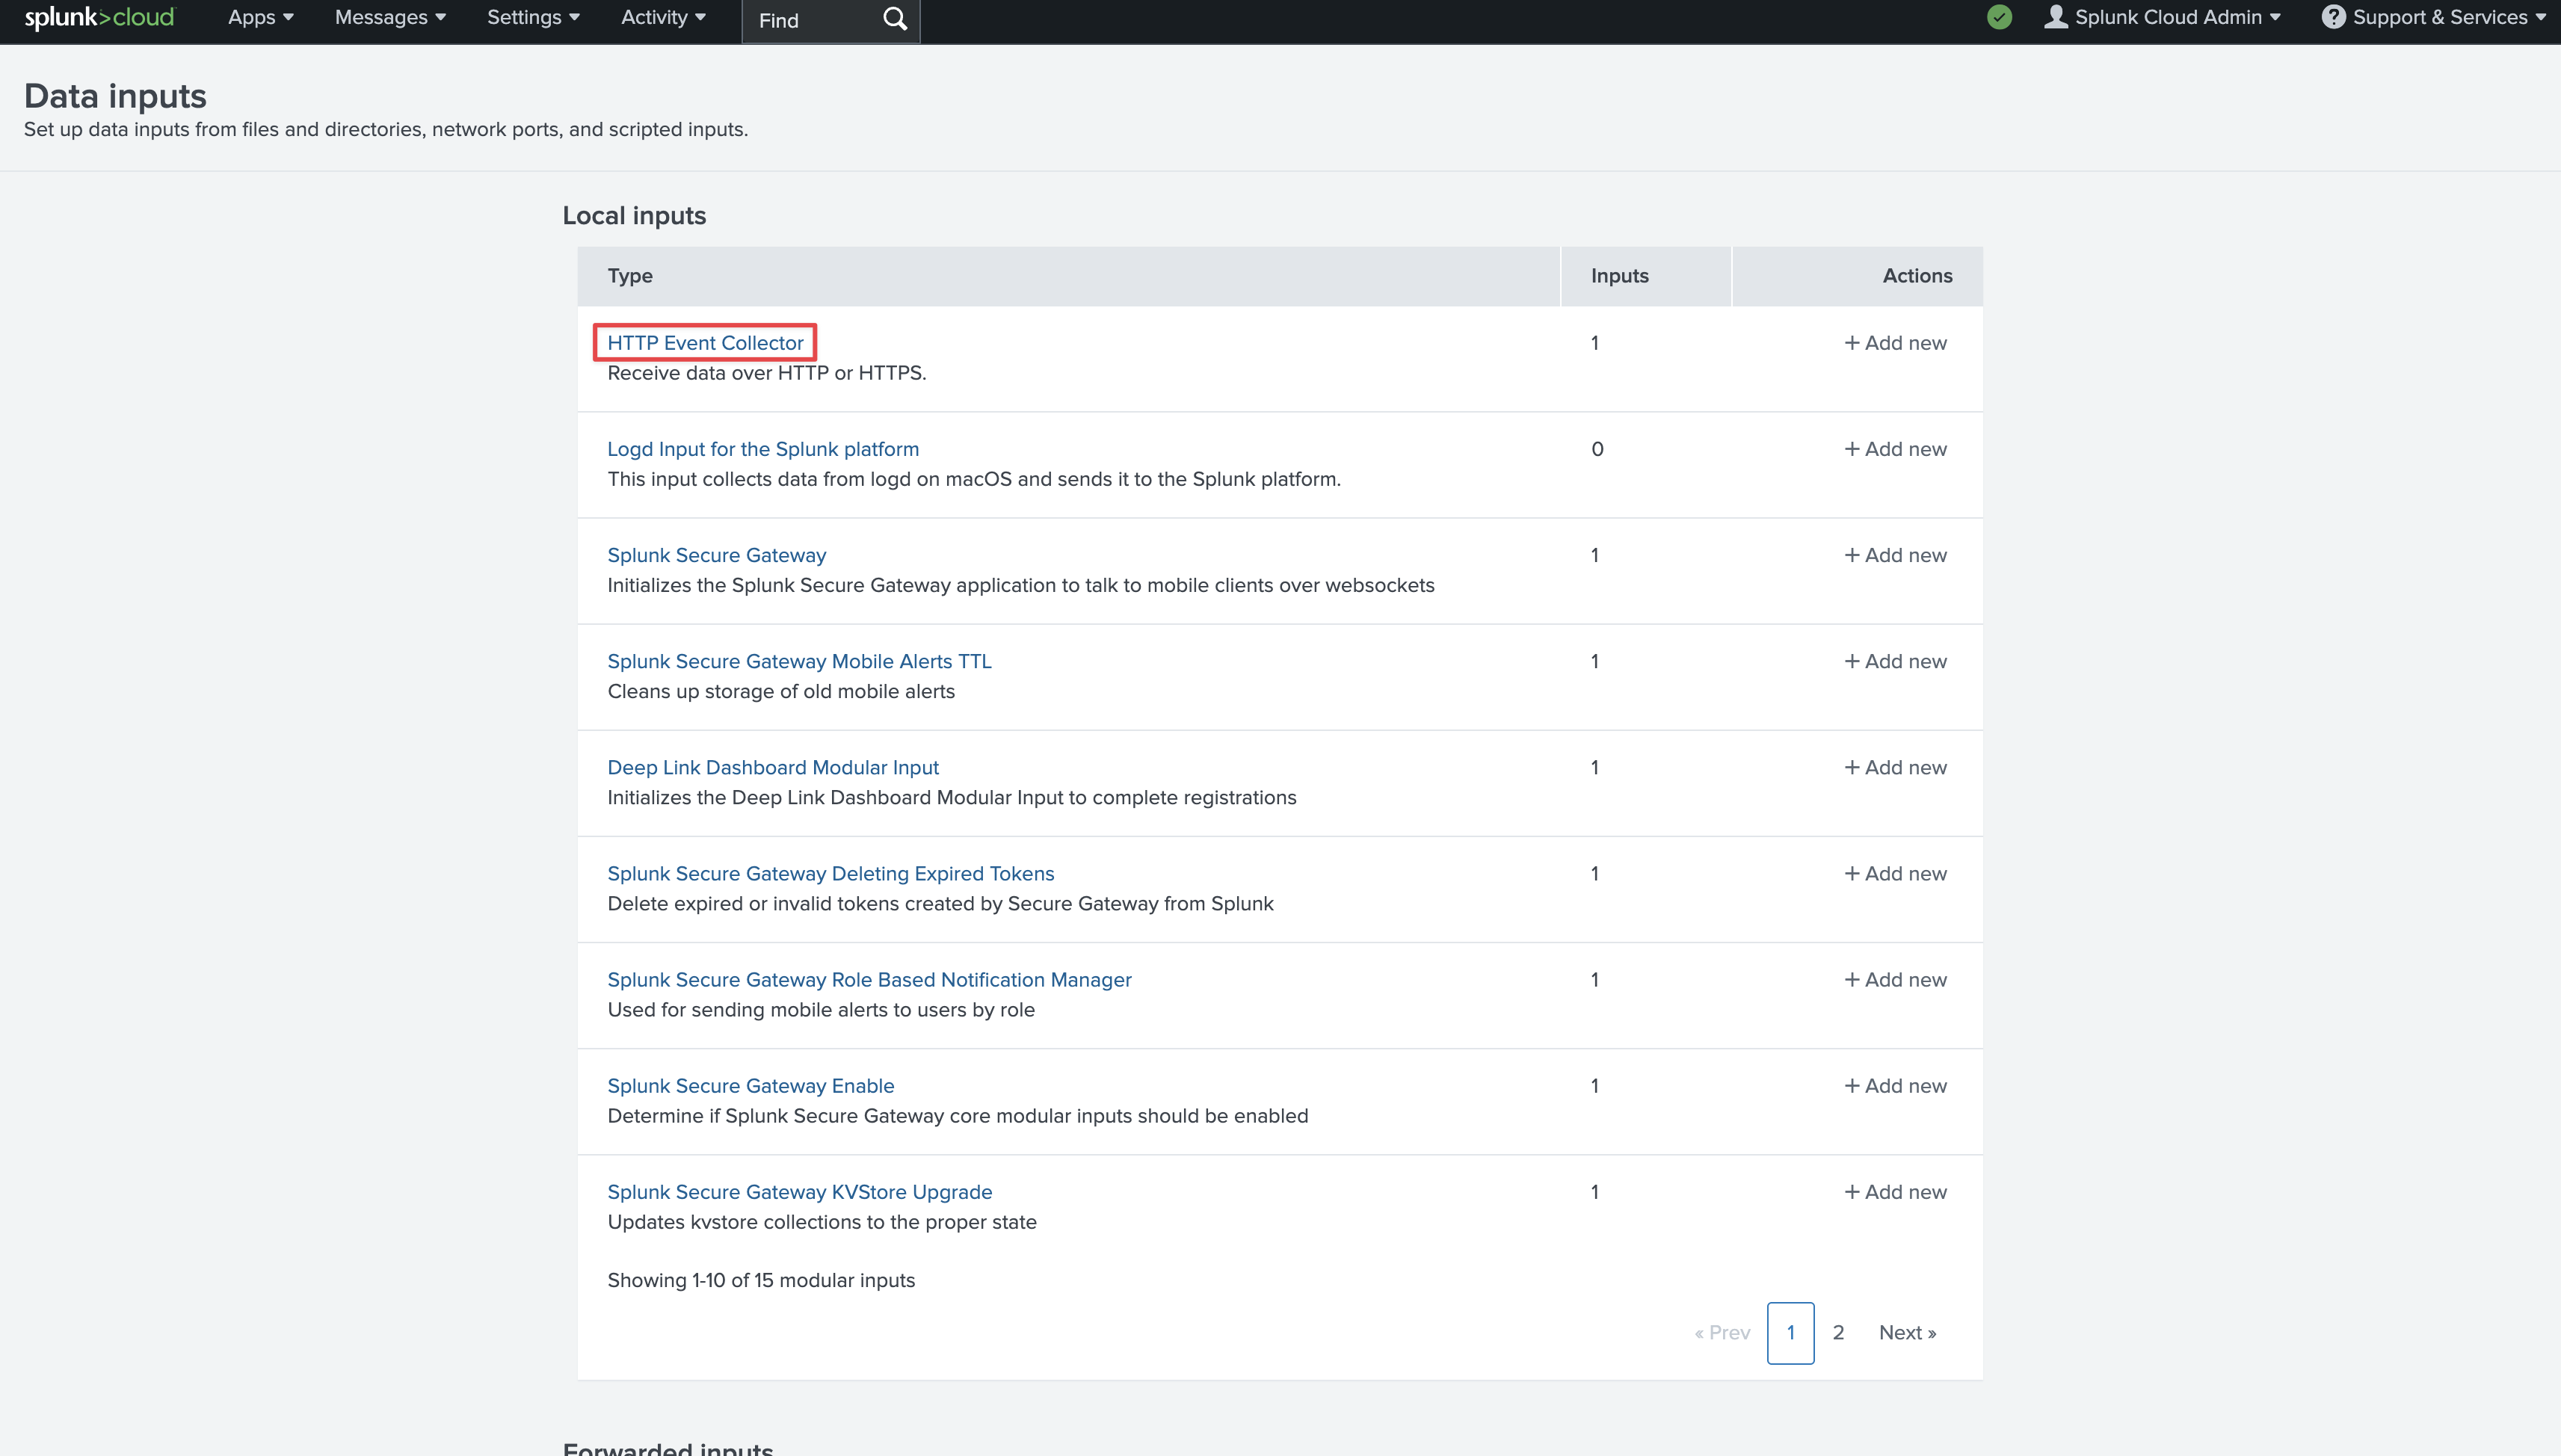 Click on New Token in the top right.
 Provide a name and click Next.
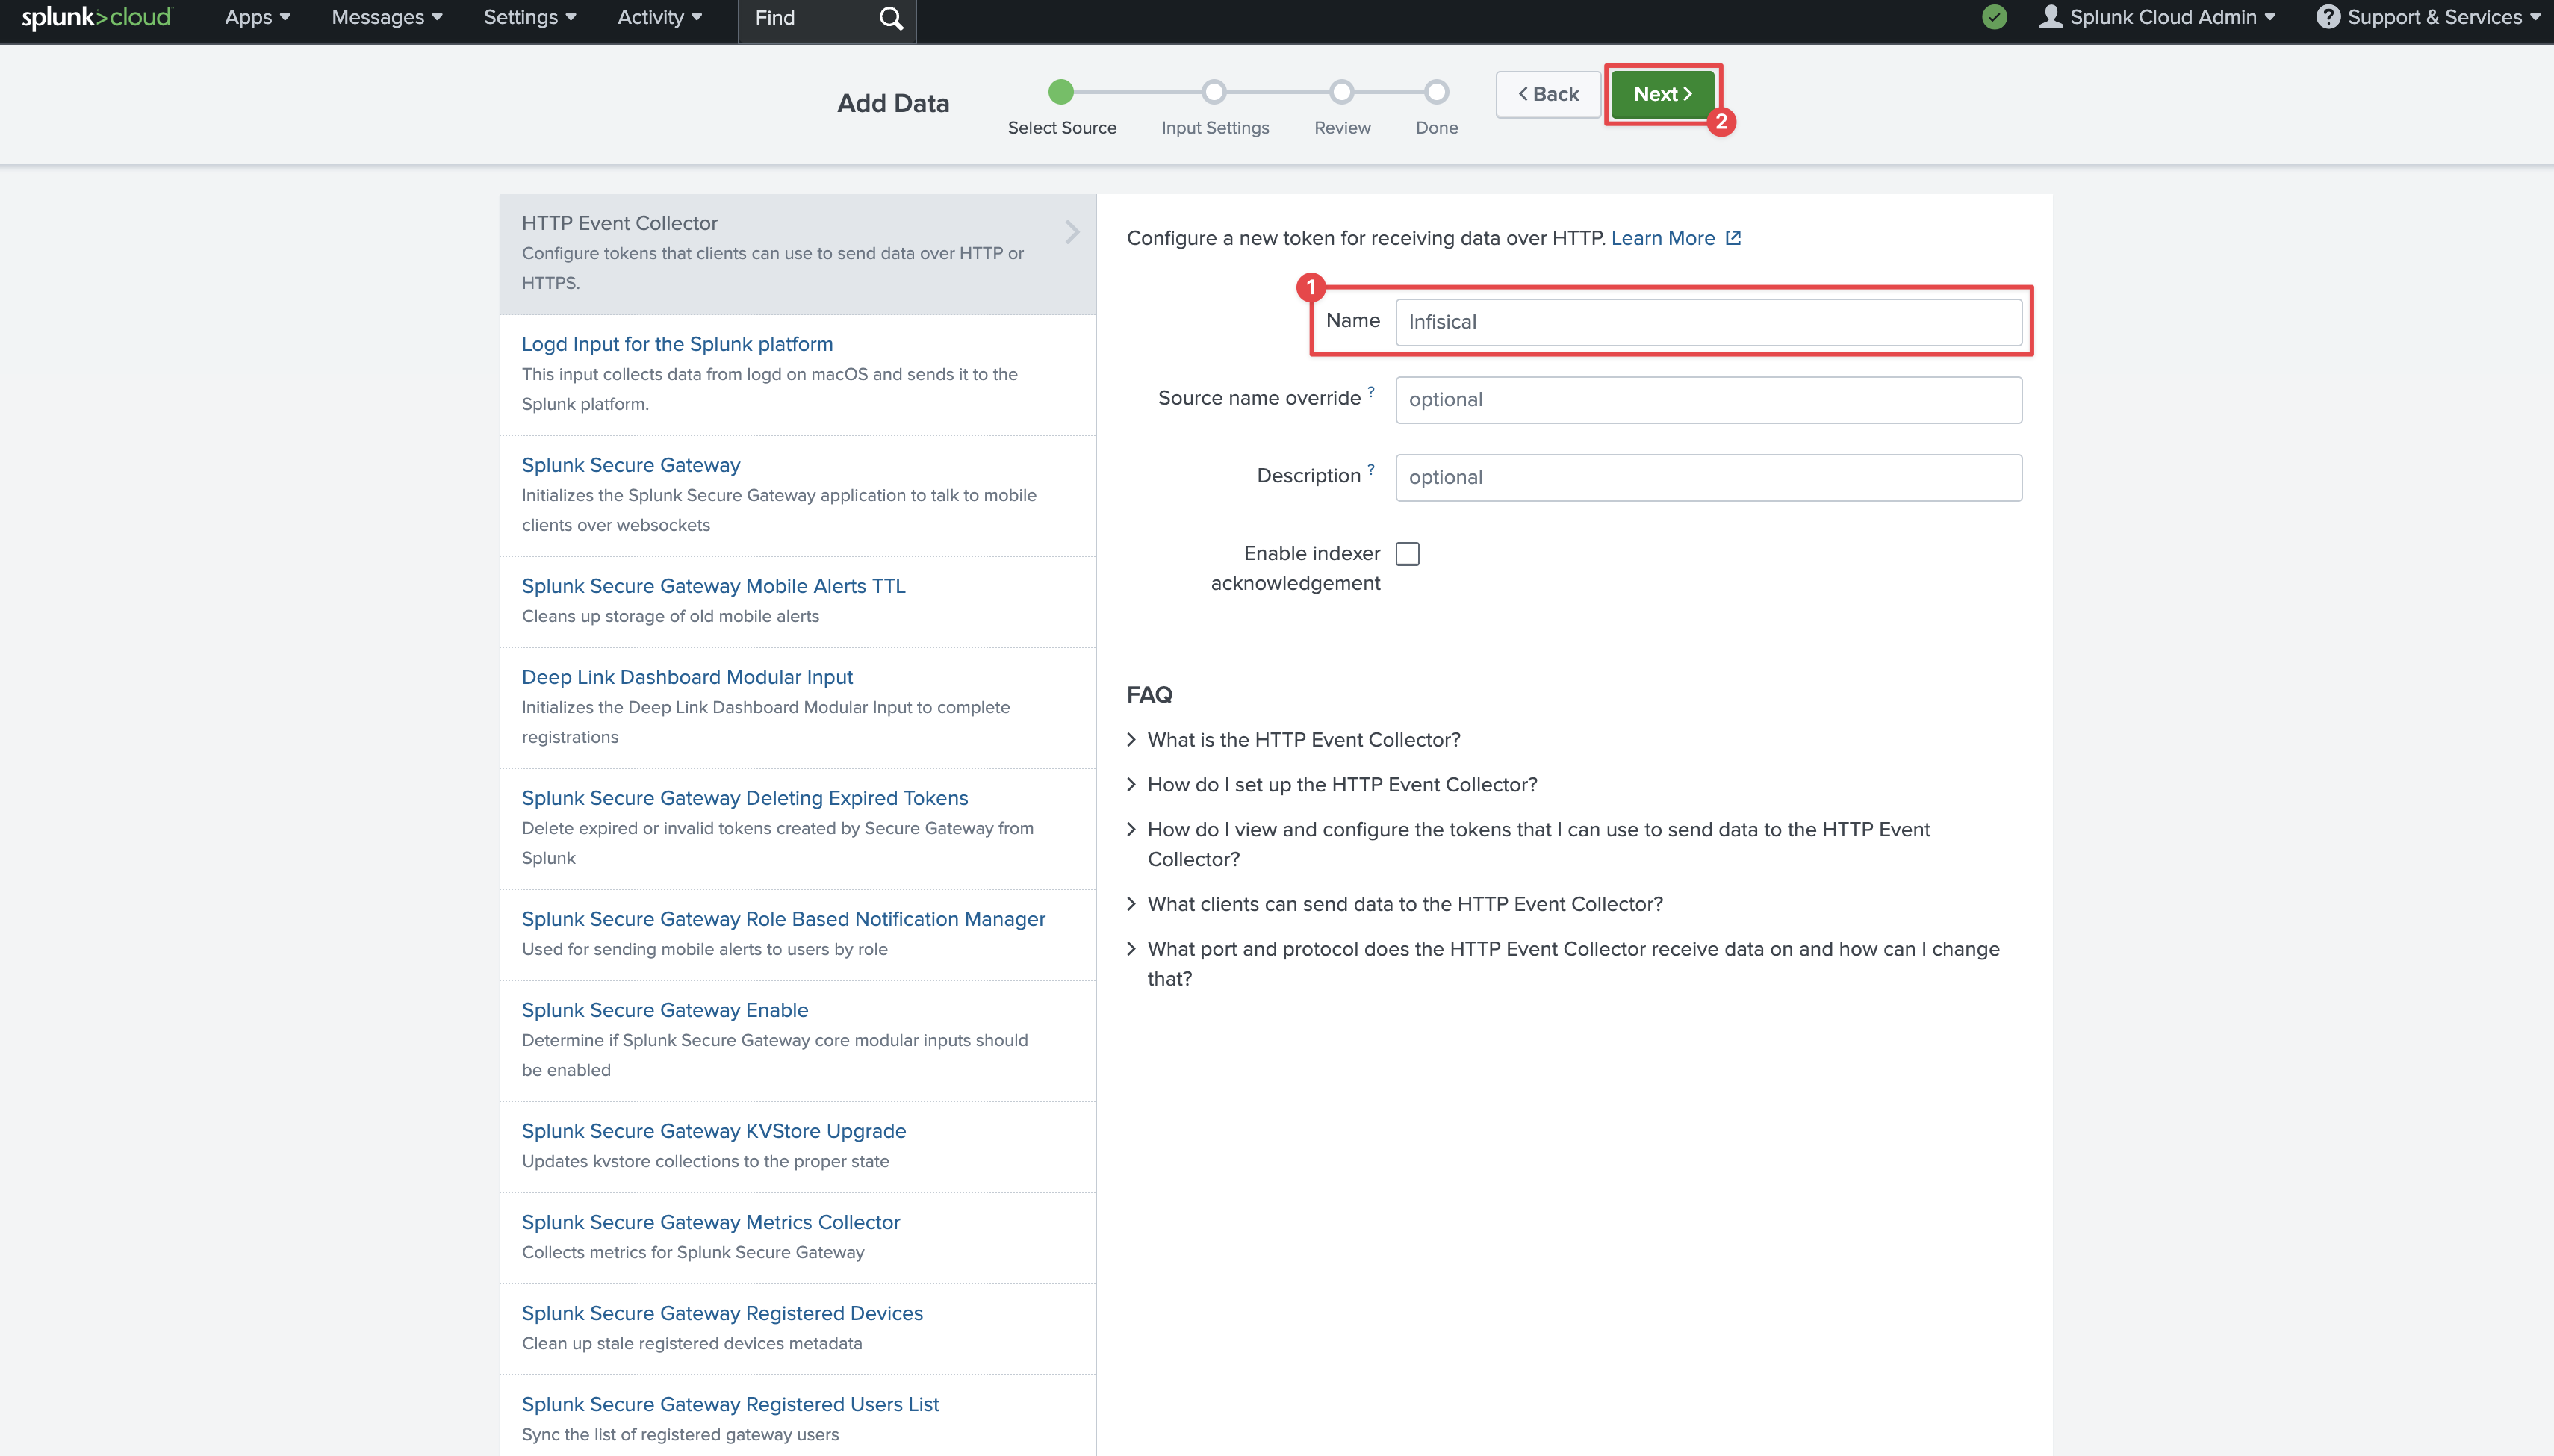 On the next page, click Review and then Submit at the top. On the final page you’ll see your token.Copy the Token Value and your Splunk hostname from the URL to be used for later.
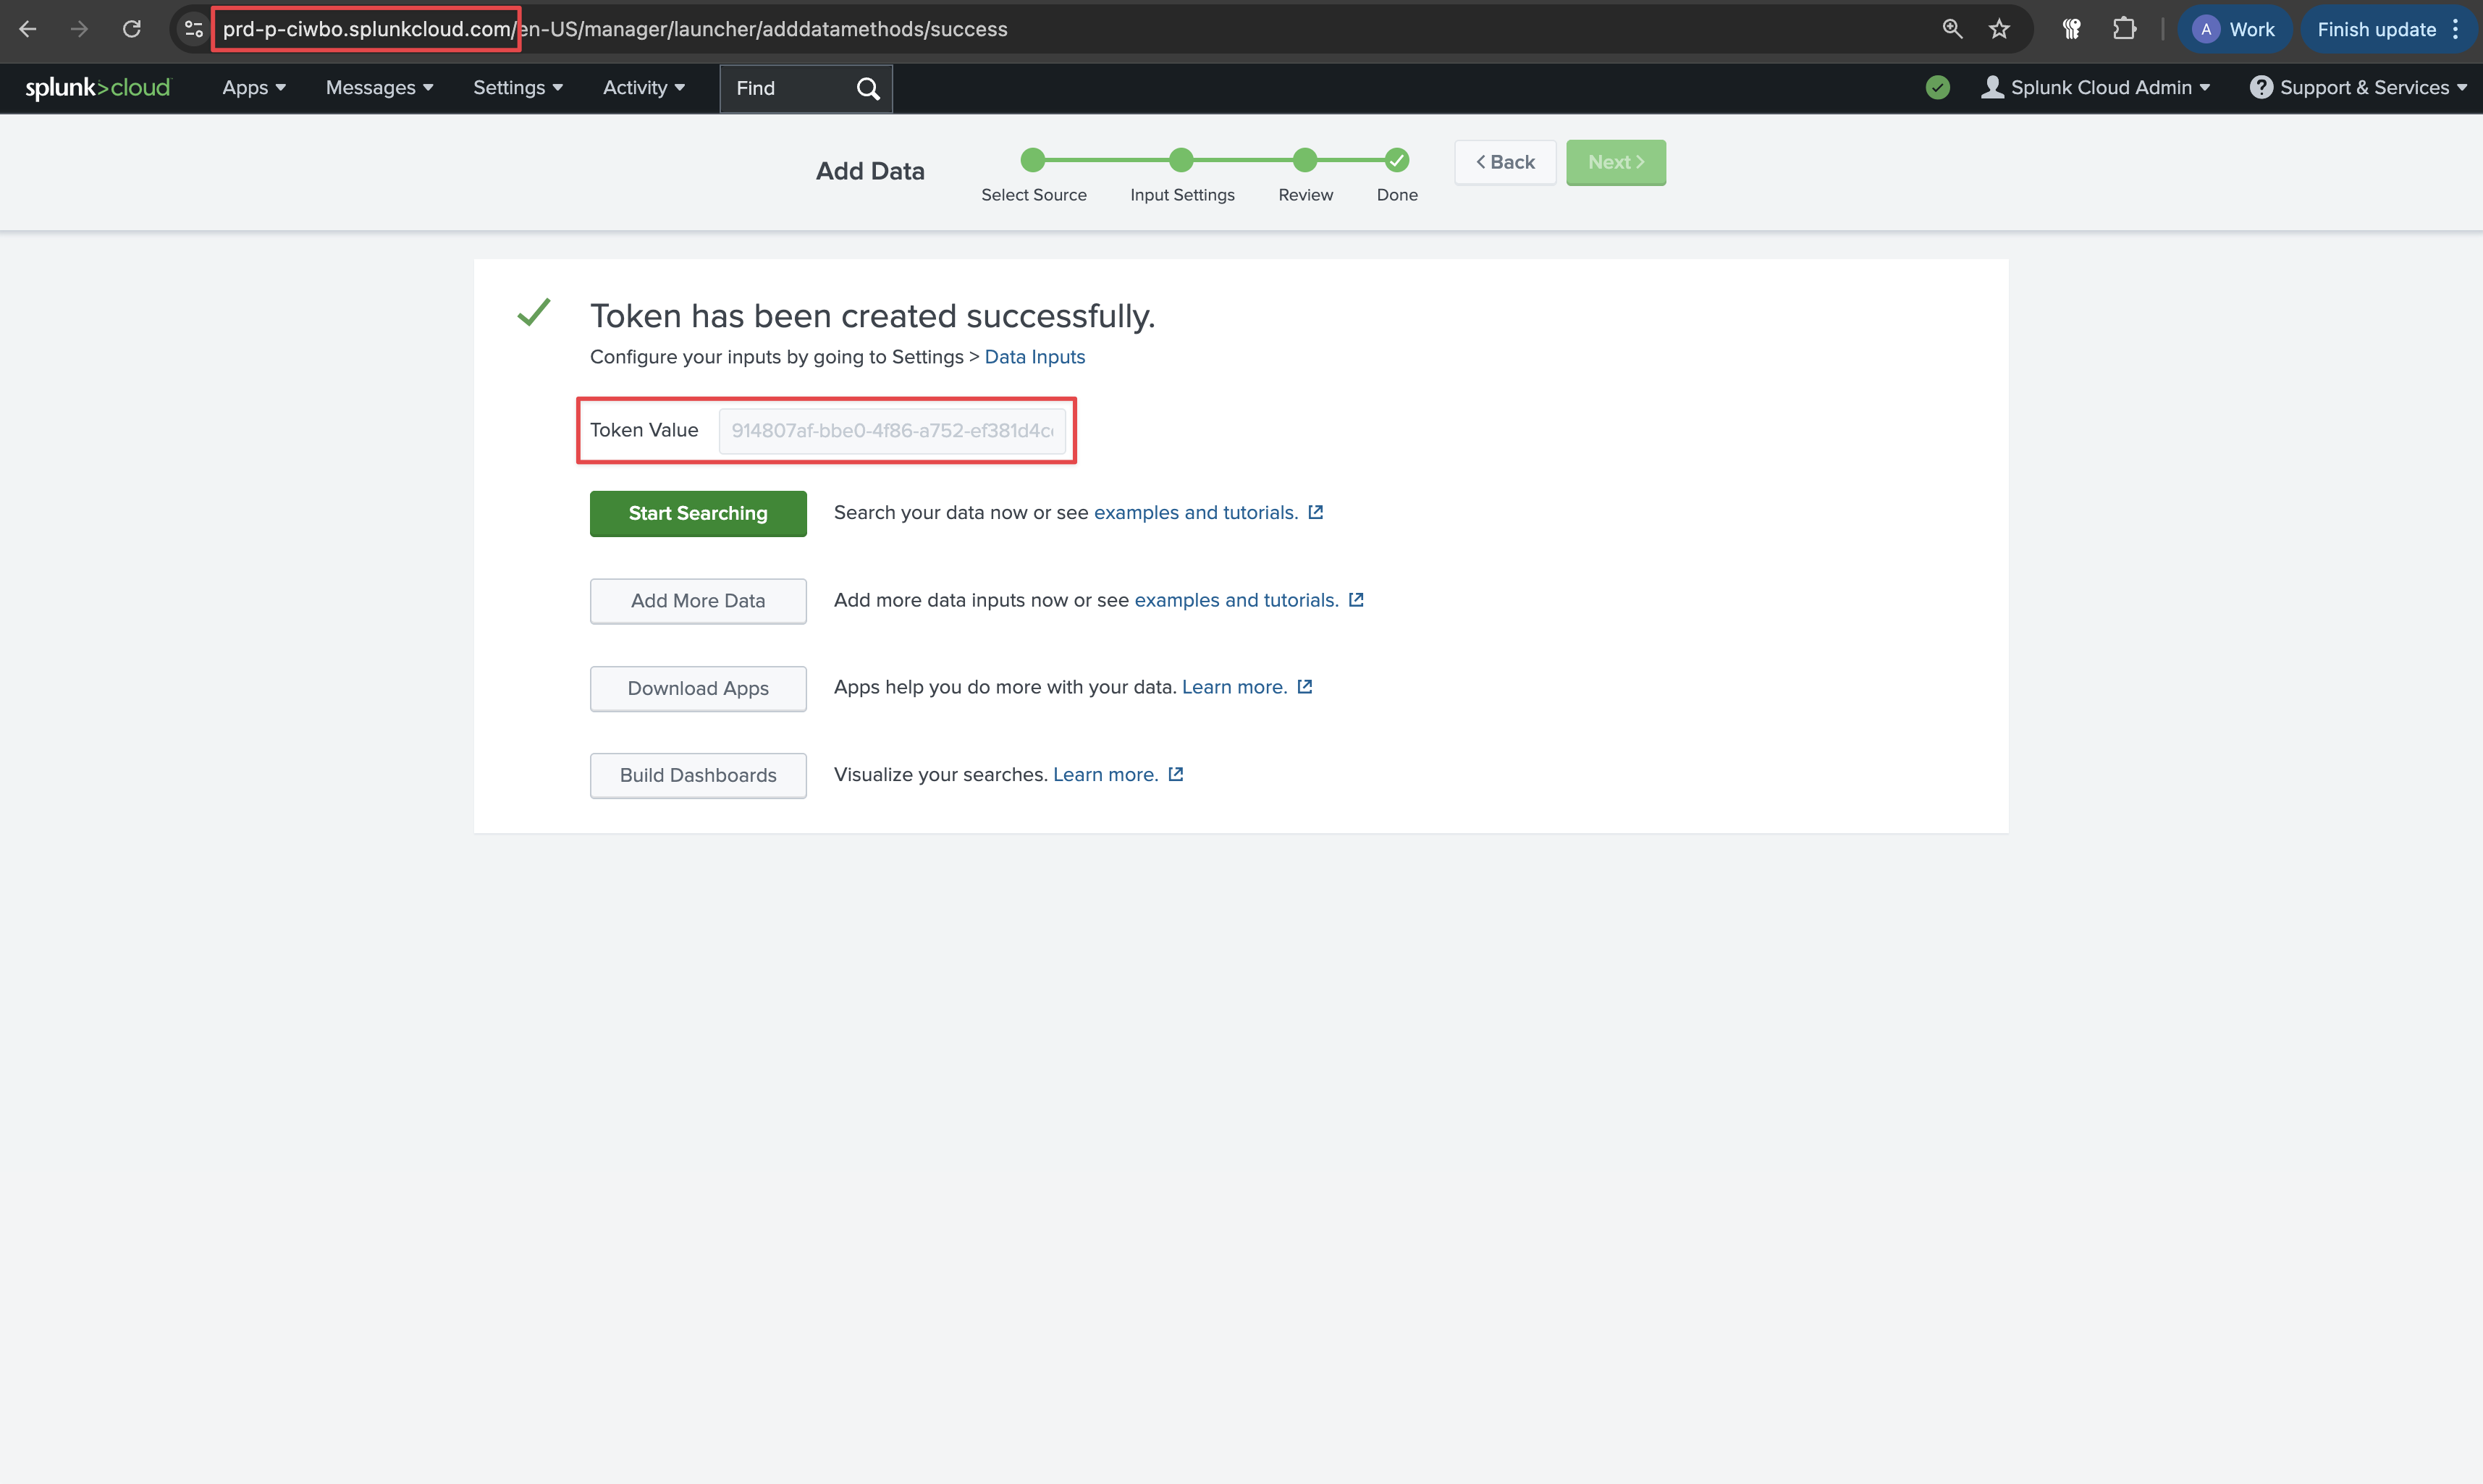
Click on HTTP Event Collector.Click on New Token in the top right.Provide a name and click Next.On the next page, click Review and then Submit at the top. On the final page you’ll see your token.Copy the Token Value and your Splunk hostname from the URL to be used for later.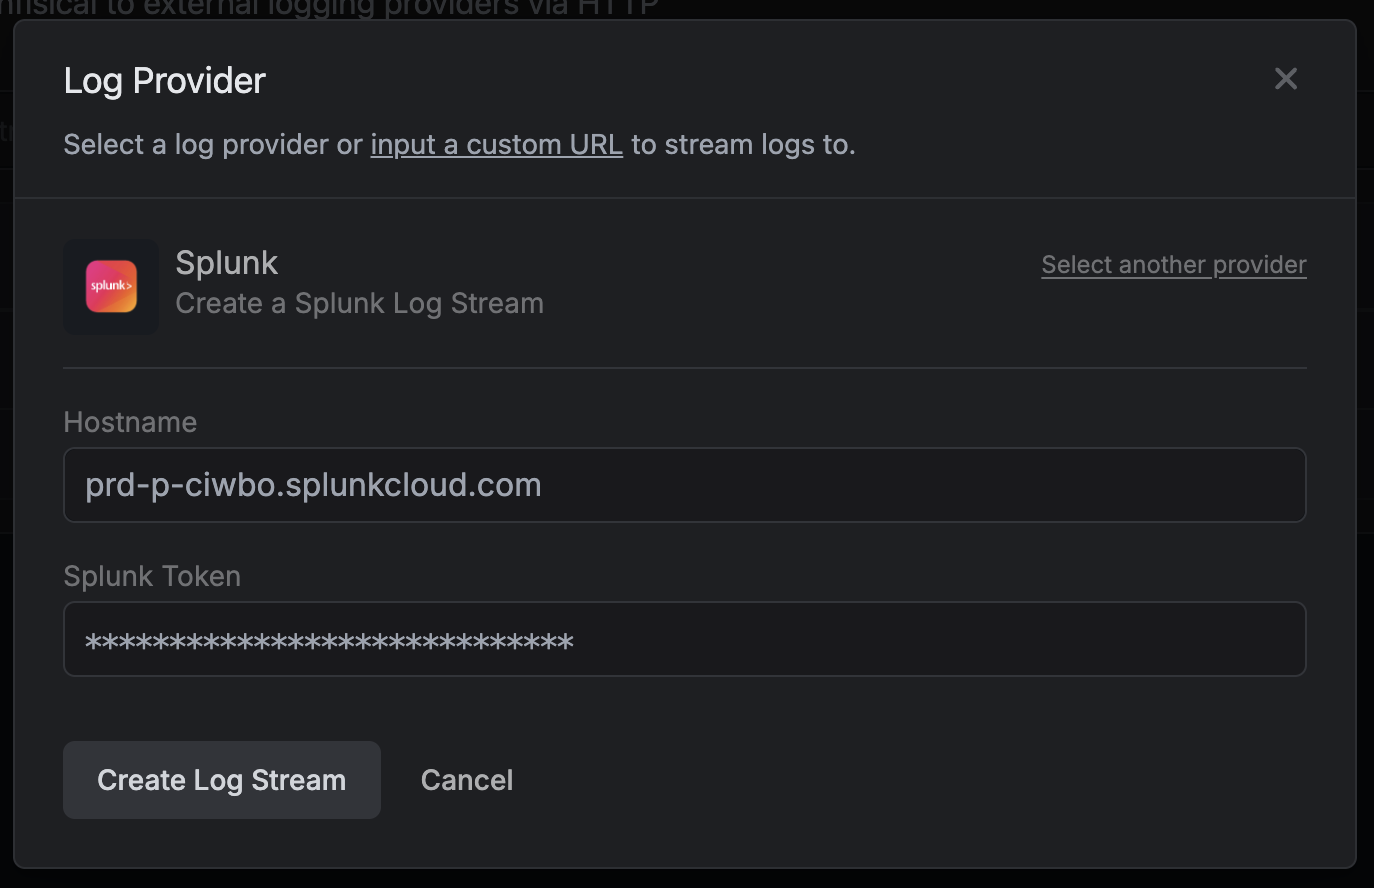
Palo Alto Networks XSIAM
Palo Alto Networks XSIAM
XSIAM accepts log data from external sources via its Custom HTTP Log Collector, which exposes a unique HTTPS endpoint secured by an API key.Infisical’s Custom audit log stream provider sends JSON-formatted audit events to that endpoint, making the integration straightforward.
Create an HTTP Log Collector in XSIAM
In your XSIAM tenant, follow Palo Alto’s guide to Set up an HTTP Log Collector to Receive Logs.Configure the collector:
Click Save. XSIAM will generate a Collector URL and an API Key for this instance. Copy both values — you’ll need them in the next step.
| Field | Value |
|---|---|
| Name | A descriptive name, e.g. Infisical Audit Logs |
| Vendor | Infisical |
| Product | Audit Logs |
The API key is only shown once at creation time. Store it in a secure location before leaving the page.
Delivery Reliability and Failure Handling
Audit log delivery is decoupled from the action that produced the event. When something happens in Infisical, the event is first recorded as an audit log and durably queued for streaming, and only then delivered to your configured destinations in the background. A streaming failure never blocks or rolls back the underlying action, and a temporary outage at your destination does not lose events that were already queued.What happens when an event fails to be pushed to a stream?
If a delivery attempt to your destination fails, the event is not discarded immediately. Instead:- Automatic retries with backoff. The event is retried automatically up to 5 attempts. Retries use exponential backoff with jitter (starting at 30 seconds and capping at roughly 4 minutes between attempts) so a struggling or rate-limiting destination is not hammered.
- Exhaustion. If all 5 attempts fail, the event is dropped from the stream. The drop is surfaced for observability through logs and metrics.
Dropping an event from a stream after exhausting retries does not remove it from Infisical’s own audit log storage. The event remains queryable in Infisical (see backfilling below) as long as audit log storage is enabled.
Can I manually retry a failed event?
There is no manual “retry” or “replay” button so far, and retries are not something you trigger yourself. Retrying is fully automatic, as described above: every event is retried up to 5 times with backoff, and crashed or stalled deliveries are automatically recovered by the background sweeper. In practice, transient destination outages recover on their own once the destination is reachable again, with no action required on your side.How can I backfill lost events into my SIEM?
Because streaming is best-effort with bounded retries, your durable source of truth for compliance is Infisical’s own audit log storage, not the stream. To backfill events that were dropped (or that occurred while a stream was misconfigured or disabled), re-ingest them from Infisical’s stored audit logs:- Identify the gap. Use error logs (self-hosted), or the time range of the destination outage, to determine which window of events is missing from your SIEM.
- Export the events from Infisical. Query the missing window from Infisical’s audit logs, filtered by event type, actor, project, and date range:
- In the UI, under Organization Settings → Audit Logs.
- Via the Export Audit Logs API, which returns events in the same structure shown below and can be paginated over the affected time range.
- Re-ingest into your SIEM. Push the exported events into your SIEM using its native ingestion API. The exported fields match the audit log structure below, so the same parsing and transformation rules you already use for the live stream apply to backfilled events.
Delivery Format
Infisical streams audit logs to your destination in batches. Rather than sending one HTTP request per event, Infisical accumulates events and delivers them together, which improves throughput and reduces load on your receiver. For Custom streams, each request is an HTTPPOST with a body containing a JSON array of audit log events:
Legacy single-event delivery. Custom and Cribl streams created before batch delivery was introduced continue to receive one event per request as a single JSON object, so existing receivers keep working unchanged. You can upgrade such a stream to batch delivery by editing it and enabling Batch delivery in the form. This switch is one-way — once a stream is on batch delivery it cannot be reverted to single-event delivery, so confirm your endpoint accepts batched events first (a JSON array for Custom, or newline-delimited JSON (NDJSON) for Cribl). The Azure, Datadog, and Splunk providers always batch and have no single-event mode.
Example Log Entry
The example below shows a single audit log event. For Custom streams using batch delivery, this object appears as an element inside the JSON array described above.Audit Logs Structure
The unique identifier for the log entry.
The entity responsible for performing or causing the event; this can be a user or service.
The metadata associated with the actor. This varies based on the actor type.
User Metadata
User Metadata
Identity Metadata
Identity Metadata
If the
actor field is set to platform, scimClient, or unknownUser, the actorMetadata field will be an empty object.The IP address of the actor.
The type of event that occurred. Below you can see a list of possible event types. More event types will be added in the future as we expand our audit logs further.
get-secrets, delete-secrets, get-secret, create-secret, update-secret, delete-secret, get-workspace-key, authorize-integration, update-integration-auth, unauthorize-integration, create-integration, delete-integration, add-trusted-ip, update-trusted-ip, delete-trusted-ip, create-service-token, delete-service-token, create-identity, update-identity, delete-identity, login-identity-universal-auth, add-identity-universal-auth, update-identity-universal-auth, get-identity-universal-auth, create-identity-universal-auth-client-secret, revoke-identity-universal-auth-client-secret, get-identity-universal-auth-client-secret, create-environment, update-environment, delete-environment, add-workspace-member, remove-workspace-member, create-folder, update-folder, delete-folder, create-webhook, update-webhook-status, delete-webhook, webhook-triggered, get-secret-imports, create-secret-import, update-secret-import, delete-secret-import, update-user-workspace-role, update-user-workspace-denied-permissions, create-certificate-authority, get-certificate-authority, update-certificate-authority, delete-certificate-authority, get-certificate-authority-csr, get-certificate-authority-cert, sign-intermediate, import-certificate-authority-cert, get-certificate-authority-crl, issue-cert, get-cert, delete-cert, revoke-cert, get-cert-body, create-pki-alert, get-pki-alert, update-pki-alert, delete-pki-alert, create-pki-collection, get-pki-collection, update-pki-collection, delete-pki-collection, get-pki-collection-items, add-pki-collection-item, delete-pki-collection-item, org-admin-accessed-project, create-certificate-template, update-certificate-template, delete-certificate-template, get-certificate-template, create-certificate-template-est-config, update-certificate-template-est-config, get-certificate-template-est-config, update-project-slack-config, get-project-slack-config, integration-synced, create-shared-secret, delete-shared-secret, read-shared-secret.The metadata associated with the event. This varies based on the event type.
The user agent of the actor, if applicable.
The type of user agent.
The expiration date of the log entry. When this date is reached, the log entry will be deleted from Infisical.
The creation date of the log entry.
The last update date of the log entry. This is unlikely to be out of sync with the
createdAt field, as we do not update log entries after they’ve been created.The unique identifier for the organization where the event occurred.
The unique identifier for the project where the event occurred.The
projectId field will only be present if the event occurred at the project level, not the organization level.